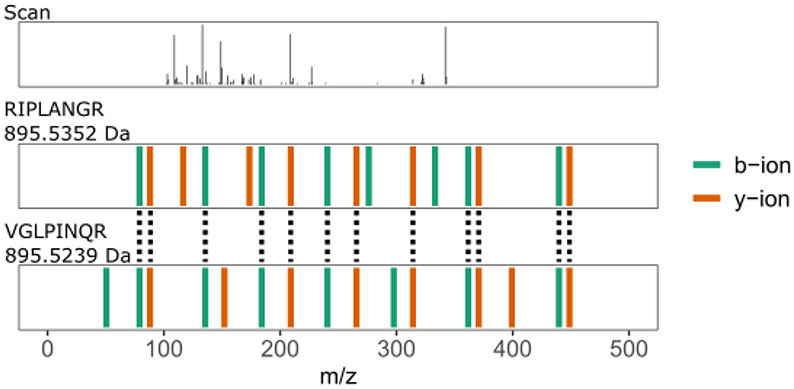
Figure 2: Example of a neighbor peptide.
This figure plots an experimental spectrum with a precursor charge of two (top) along with the best scoring neighbor peptide (middle) and the best scoring relevant peptide (bottom). Peptide “VGLPINQR” is a relevant ricin peptide (Uniprot ID: B9T8T0) and peptide “RIPLANGR” is an irrelevant castor plant peptide (Uniprot ID: B9T289). The mass difference between the two peptides is approximately 12 ppm with the mass of “VGLPINQR” being 895.5239 Da and the mass of “RIPLANGR” being 895.5352 Da. These two peptides have ~70% of their MS2 peaks in common. Dotted lines connect MS2 peaks in the same 0.05 Da bin. The combined p-value score (lower is better) between the experimental scan with the relevant peptide is 1.25 × 10⁻⁴, whereas the combined p-value score between the scan and the neighbor peptide is 1.13 × 10⁻⁴.

