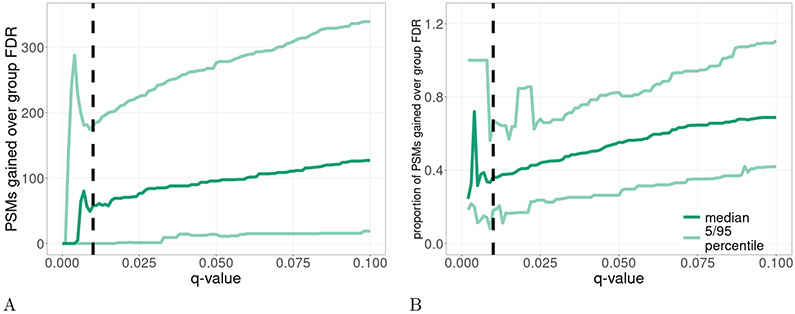
Figure 4: Comparison of subset-search and group-FDR.
This figure compares the performance of subset-search against group-FDR in the ricin dataset with respect to (A) the number of PSMs and (B) the proportional increase in number of PSMs. For each mass spectrometry run, we determine the difference in the number of PSMs detected between subset-search and group-FDR at various FDR thresholds. After collating these values across all runs, we plot the median value and 5/95 percentiles over 54 runs. The vertical dashed line is at the conventional 1% FDR threshold. Note that the plotted values in B are undefined for some q-values near 0 where neither subset-search nor group-FDR detects any PSMs.

