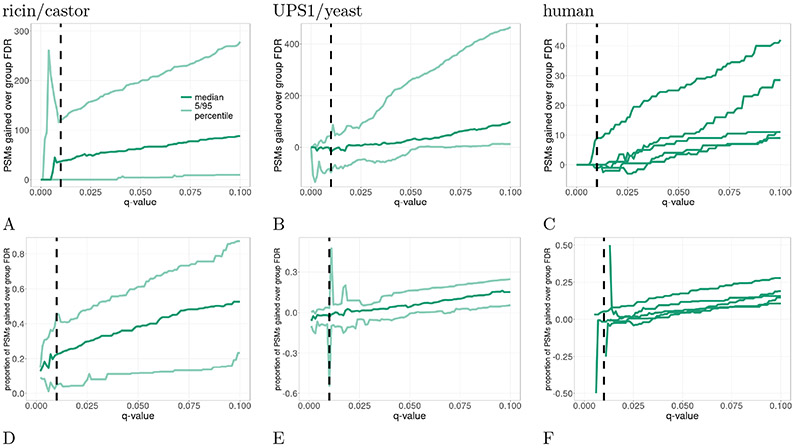
Figure 5: Comparison of SNS and group-FDR.
This plot compares the relative performance of SNS against group-FDR for the ricin (A and D), UPS1/yeast (B and E), and human dataset (C and F). For each mass spectrometry run, we determine the difference in the number of PSMs (A–C) detected between SNS and group-FDR at various q-value thresholds. In addition, we calculate the corresponding proportional increase (D–F). For F, we assigned a value of 0.5 when SNS detects any number of PSMs while group-FDR detects 0 PSMs and −0.5 when group FDR-detects any number of PSMs while SNS detects 0 PSMs. The vertical dashed line is at the conventional 1% FDR threshold. Note the plotted values in D–F are undefined for some q-values near 0, where neither SNS nor group-FDR detects any PSMs. For the human data (C and F), we only plot the median lines, where each line represents a different relevant protein.

