
Figure 1: mRNA expression of neuropeptide Y (NPY) and its receptors NPY1R, NPY2R, NPY4R and NPY5R in the PFC.
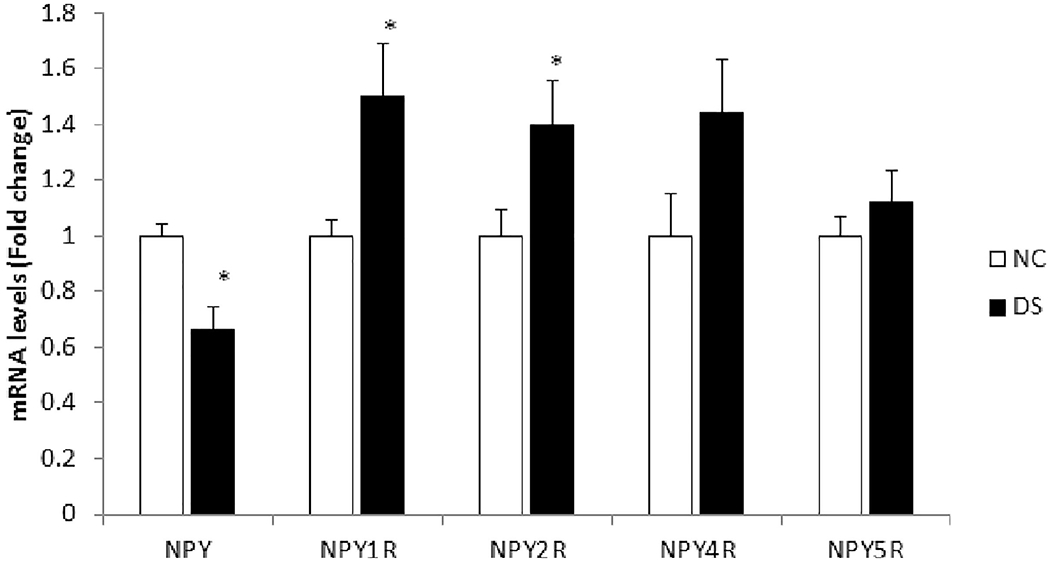
The histogram represents fold change in mRNA expression in the prefrontal cortex (PFC) of normal control (NC) and depressed suicide (DS) subjects. Values are represented as mean fold change ± SEM.
(*) represents a statistically significant difference (P≤0.05).