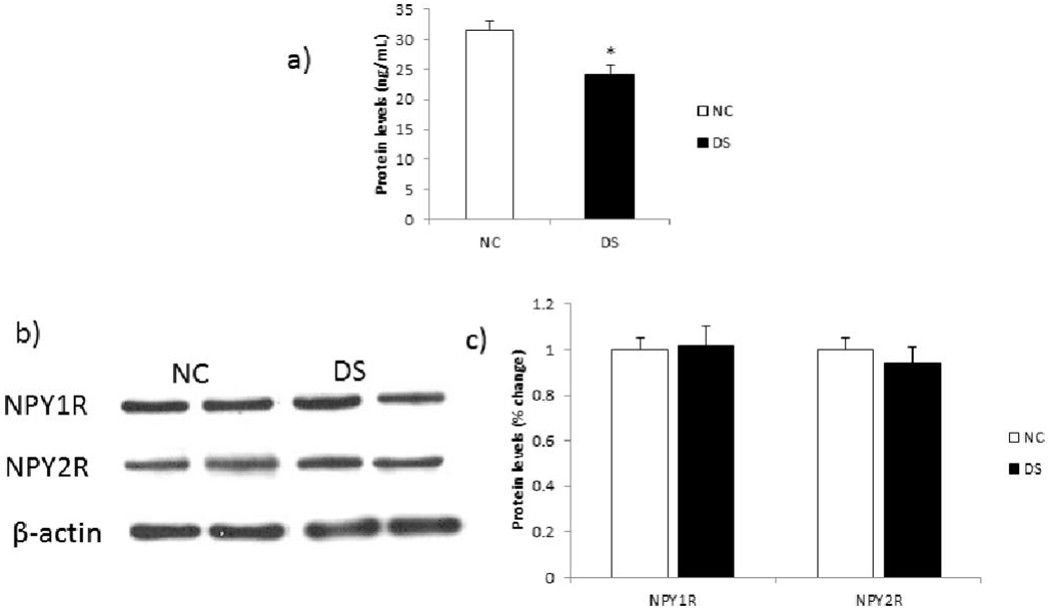
Figure 3: Protein expression of NPY and two of its receptors, NPY1R and NPY2R, in the PFC.

(a) Histogram showing protein expression of NPY (measured by ELISA) in the PFC of DS and NC subjects. Values represent mean percent change ± SEM. (*) represents a statistically significant difference (P≤0.05).
(b) Representative blots of two NPY receptors (NPY1R and NPY2R) and β-actin in the PFC of two NC and two DS subjects.
(c) Histogram showing corresponding percentage change in protein expression of these NPY receptors in the PFC of NC and DS subjects. Values represent mean percent change ± SEM.
