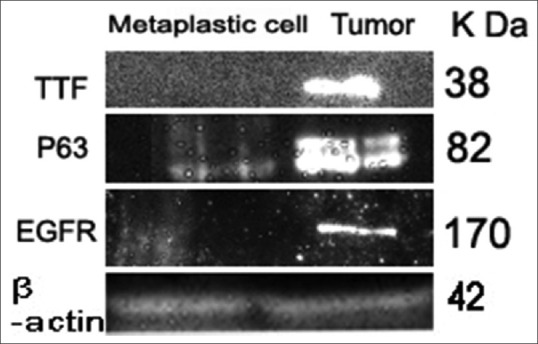
Figure 1.

Western blot analysis of TTF1, p63 & EGFR. Lane. 1. Shows dense bands for tumor samples, diffuse expression for samples with metaplastic cells at 38 k Da corresponding to TTF1 protein. Lane. 2. Shows dense bands for tumor sample, mild bands for samples with metaplastic cells at 63 k Da corresponding to p63 protein. Lane. 3. Shows dense bands for tumor and metaplastic cells at 42 k Da corresponding to ß actin
