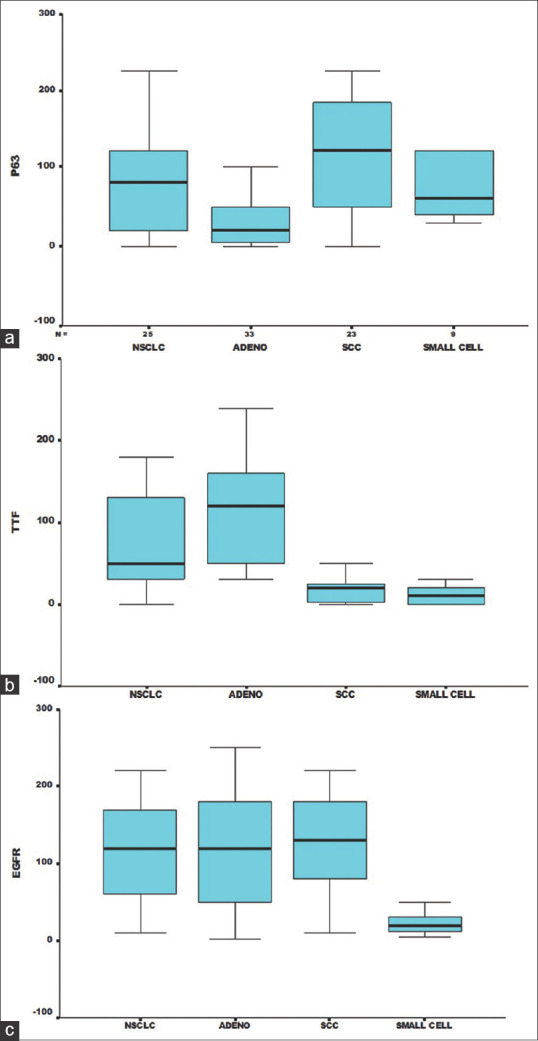
Figure 2.

(a) Boxplot showing mean H score of p63 with respect to different histologic types of lung cancer. (b) Boxplot showing mean H score of TTF1 with respect to different histologic types of lung cancer. (c) Boxplot showing mean H score of EGFR with respect to different histologic types of lung cancer
