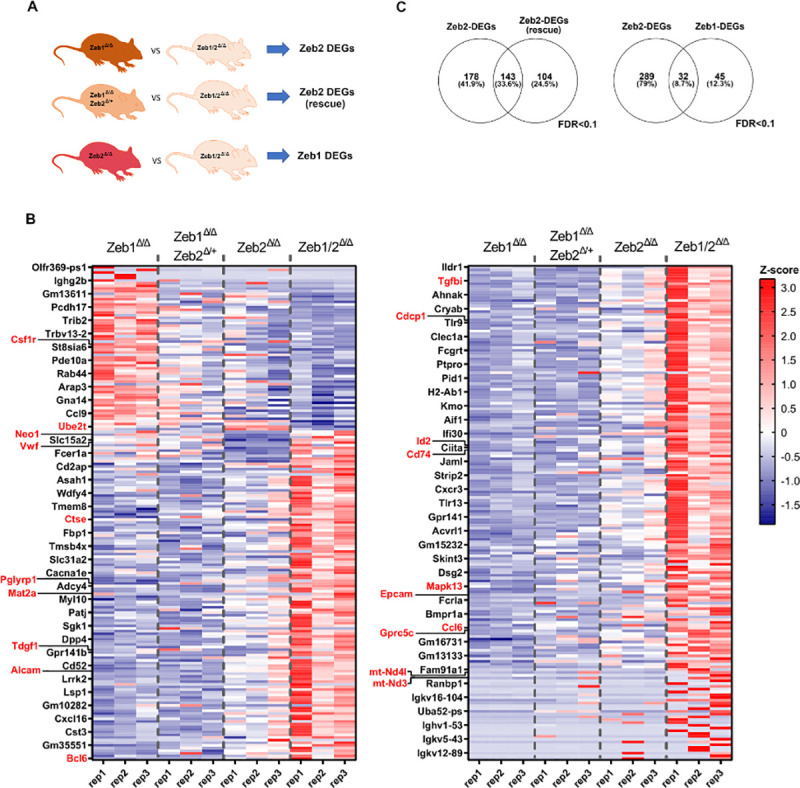
Fig 6. RNA-seq analysis of LSK-enriched populations reveals both common and unique immediate early gene expression programs controlled by Zeb1 and Zeb2.

(A) DEG lists obtained with edgeRun R package, when comparing R26-Cre-ERT2; Zeb2fl/fl (Zeb2Δ/Δ), R26-Cre-ERT2; Zeb2fl/+, Zeb1fl/fl (Zeb2Δ/+, Zeb1Δ/Δ), and Zeb1fl/fl (Zeb1Δ/Δ) against iDKO R26-Cre-ERT2 Zeb1/2 fl/fl (Zeb1/2Δ/Δ), respectively. To define DEGs, we used as cutoff an FDR <0.1. (B) Heatmap of >360 combined ZEB1 and ZEB2 DEGs, sorted from most induced to repressed ZEB2-DEGs. From left to right, we plotted the Z-scores of gene expression of R26-Cre-ERT2 Zeb2 fl/fl (Zeb2Δ/Δ), single R26-Cre-ERT2; Zeb2fl/+ allele, Zeb1fl/fl (Zeb2Δ/+, Zeb1Δ/Δ) and the iDKO R26-Cre-ERT2; Zeb1/2fl/fl (Zeb1/2Δ/Δ), respectively. (C) (Left) Intersections of DEGs from Zeb1 null cells expressing double or a single Zeb2 allele against iDKO cells, respectively. (Right) Intersections of DEGs from Zeb1 or Zeb2 null cells against iDKO cells, respectively. Raw data behind (B) are included in S2 Table. DEG, differentially expressed gene; DKO, double knockout; FDR, false discovery rate; iDKO, inducible double knockout; LSK, Lin−Sca1+cKit+; RNA-seq, RNA sequencing.
