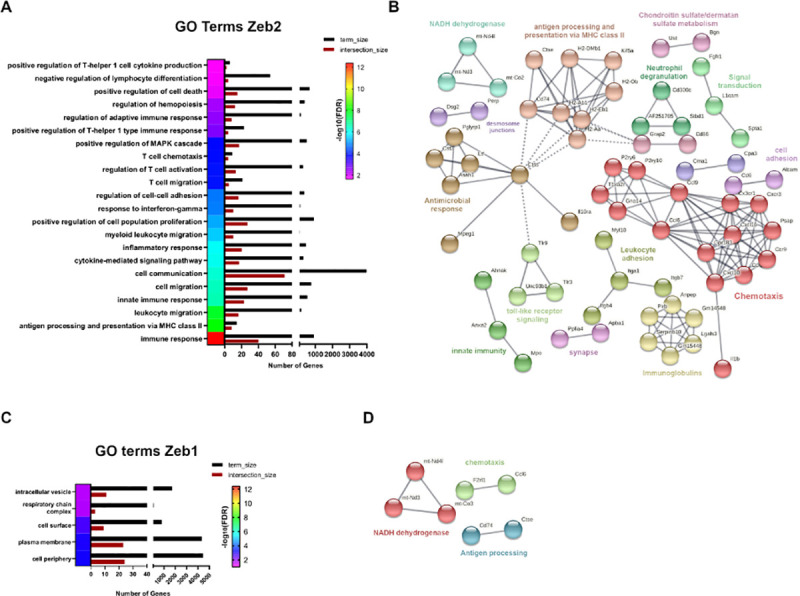
Fig 7. RNA-seq analysis of LSK-enriched populations reveals both common and unique immediate early gene expression programs controlled by ZEB1 and ZEB2.

(A) Associated GO terms with ZEB2-DEGs, obtained with the STRING database, using an FDR <0.05). (B) Associated network analysis for ZEB2-DEGs, obtained with STRING database using highest confidence interaction scores (0.900) and clustered with an MCL inflation parameter of 3. (C) Same as (A) for ZEB1 DEGs. (D) Same as (B) for Zeb1 DEGs. Raw data behind panels are included in S3 Table. DEG, differentially expressed gene; FDR, false discovery rate; GO, gene ontology; LSK, Lin−Sca1+cKit+; RNA-seq, RNA sequencing.
