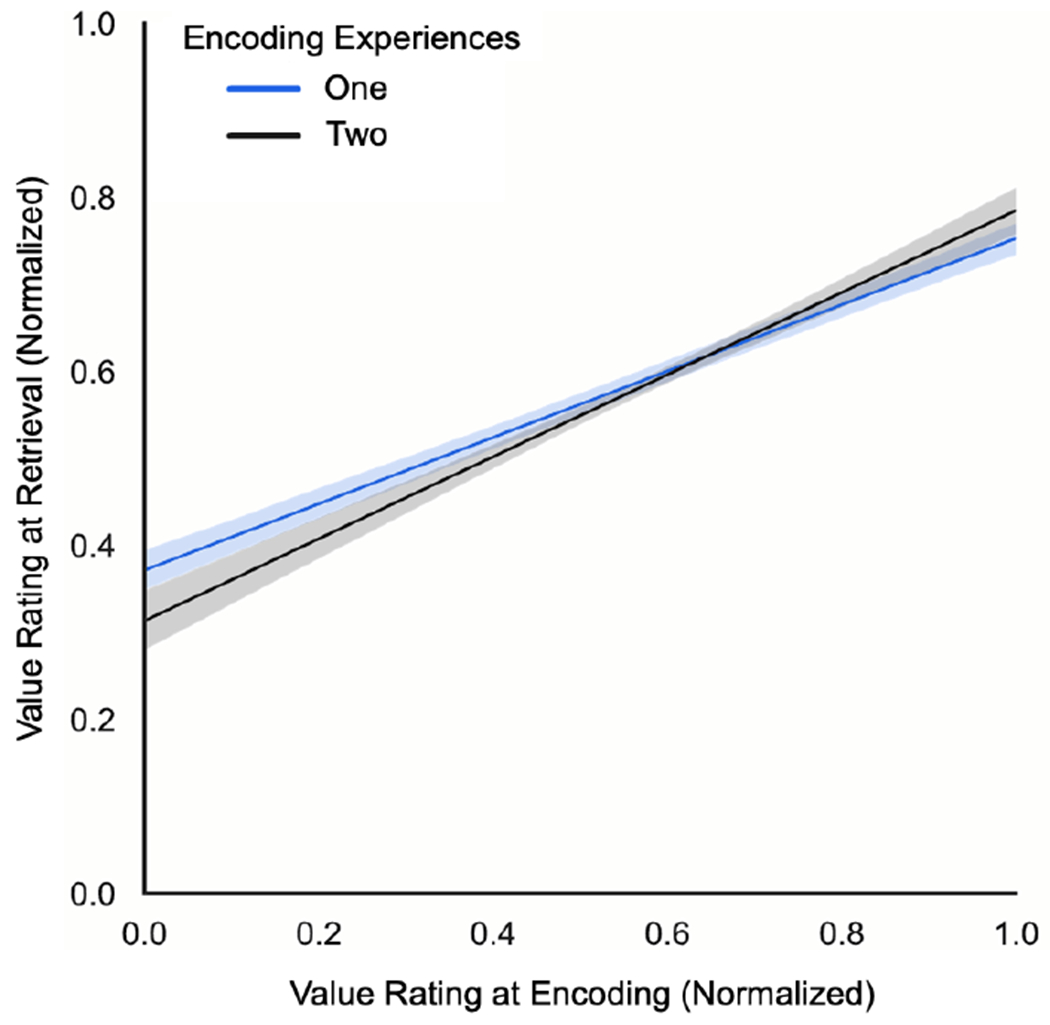
Figure 4. Correspondence between value ratings across value encoding and retrieval.

Note. Normalized value ratings during value retrieval were found to scale alongside value encoding ratings (averaged for products with two consumer reviews), regardless of the number of encoding experiences. For visual comparison purposes, discrete value encoding ratings (X-axis) and continuous value retrieval ratings (Y-axis) were normalized to a 0-1 scale, representing negative (0) to positive (1) value ratings. Shading represents 95% confidence intervals for each regression line.
