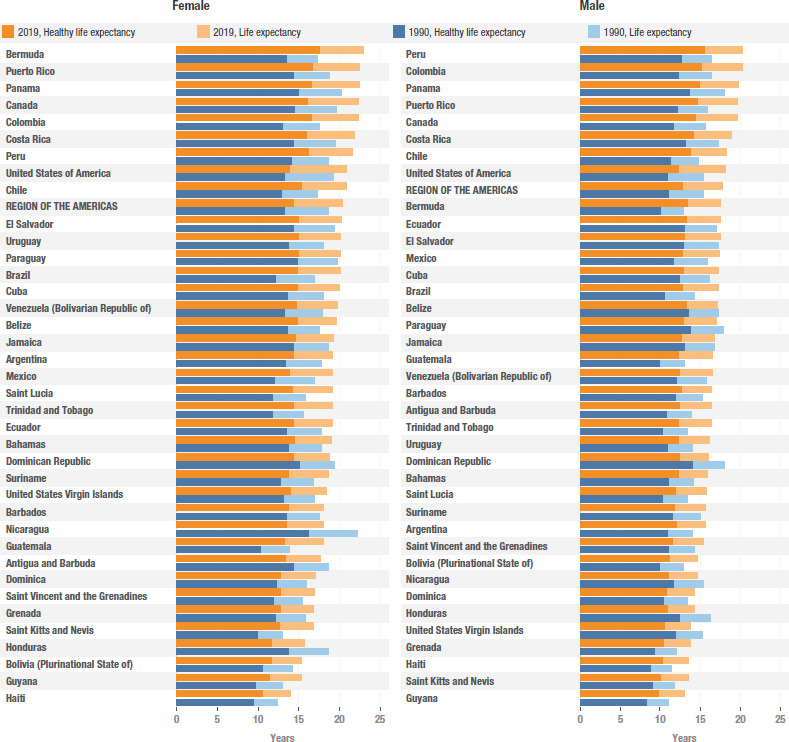
FIGURE 1. Life expectancy and healthy life expectancy at 65 years of age by country and sex, Region of the Americas, 1990 and 2019.

Source: Based on results obtained from the analysis of estimates from the Global Burden of Disease Study 2019. Countries are presented in descending order of rates of disability-adjusted life years (DALY) per 100 000 population in 2019 in each sex separately. The combination of life expectancy measures and years is color-coded as presented in the legend.
