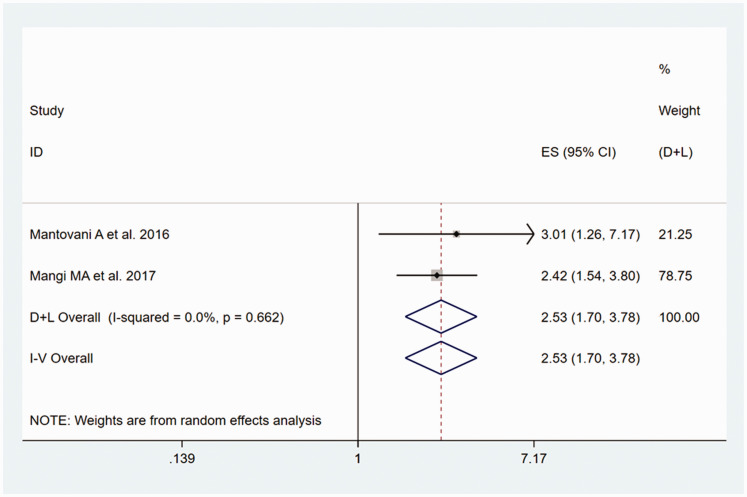
Figure 6.
Forest plot of the estimated ORs, corresponding 95% CIs and the P-values for the risk of PVC/PAC in adult participants with NAFLD, compared with those without, generated using fixed effects models.
CI, confidence interval; NAFLD, non-alcoholic fatty liver disease; OR, odds ratio; PVC/PAC, premature ventricular contraction/premature atrial contraction.

