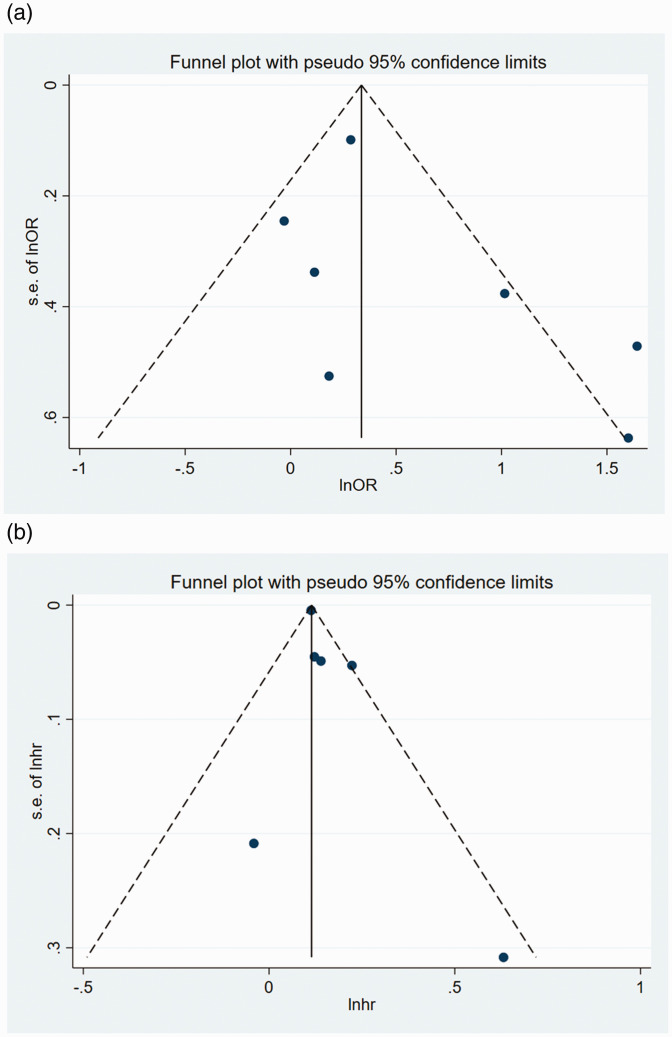
Figure 8.
Funnel plots of studies reporting the risk of AF in adult participants with or without NAFLD. (a) OR data for participants with AF. (b) HR data for participants with AF. Pseudo-95% confidence intervals (dotted lines) are shown.
AF, atrial fibrillation; HR, hazard ratio; NAFLD, non-alcoholic liver disease; OR, odds ratio; s.e., standard error of the mean.

