Figure 1.

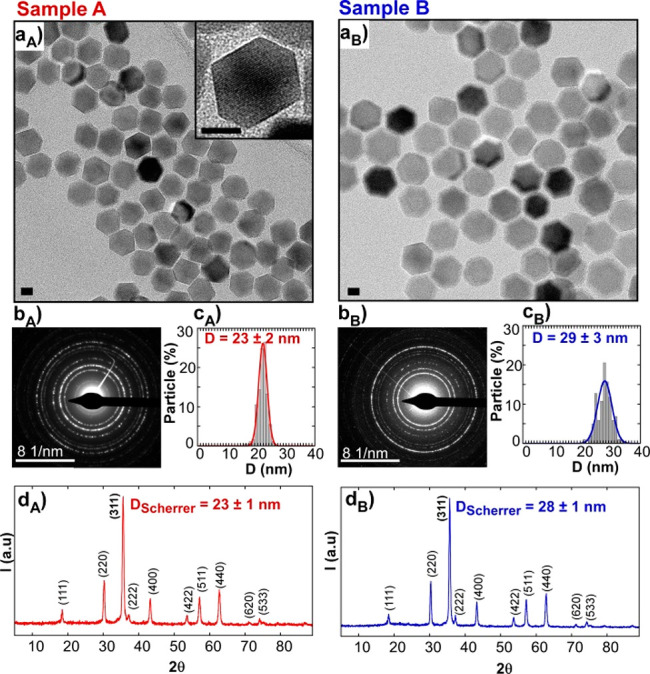
(a) TEM micrographs, (b) ED patterns, (c) size distributions, and (d) XRD patterns of Sample A and Sample B. Scale bars: 10 nm.

(a) TEM micrographs, (b) ED patterns, (c) size distributions, and (d) XRD patterns of Sample A and Sample B. Scale bars: 10 nm.