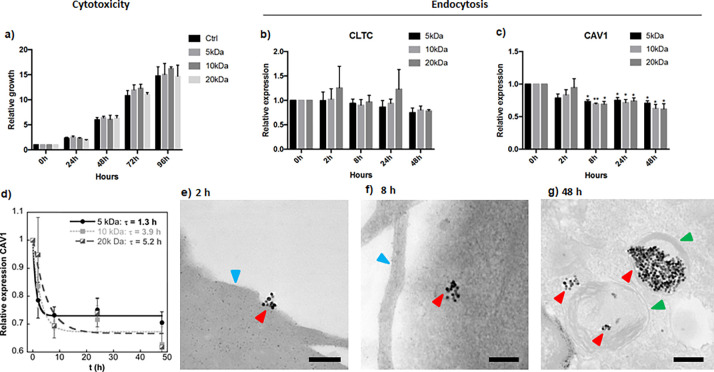
Figure 7.
(a) Cytotoxicity assay of cells incubated with sampleA@PEG (5, 10, and 20 kDa) at different time points. Growth rates were plotted as relative increase compared to 0 h. Values are represented as the mean and standard error of the mean of three independent experiments. Gene expression analysis of (b) CLTC and (c) CAV1 in cells incubated with sampleA@PEG (5, 10, and 20 kDa) at different time points. Expression was calculated relative to the housekeeping gene RPLP0 and values were plotted as relative changes compared to 0 h. Values are represented as the mean and standard error of the mean of three independent experiments. *p < 0,05, **p < 0,01; paired Student’s t test. (d) Cellular uptake kinetics of sampleA@PEG (5, 10, and 20 kDa) based on CAV1 gene expression, the uptake mean-life is calculated by curve fitting using an exponential function. Representative TEM images corresponding to incubation times of (e) 2, (f) 8, and (g) 48 h. Arrowheads: red, FM-NPs; blue, cell surface; and green, endosome. Scale bars 200 nm.

