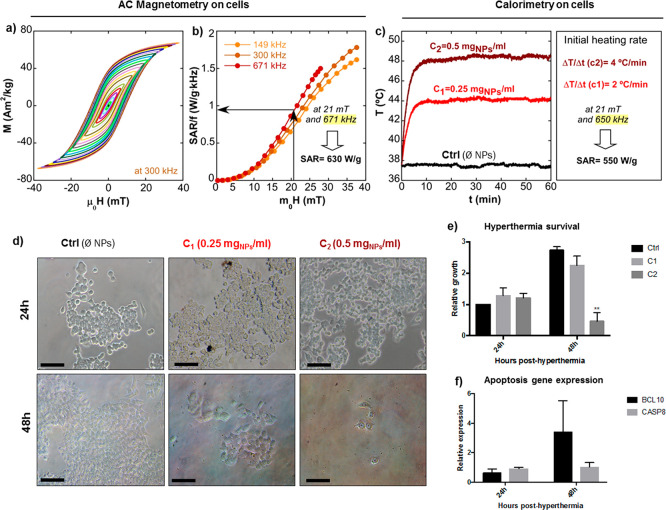
Figure 8.
Magnetic hyperthermia on colon cancer-derived cell line HCT116. (a) AC hysteresis loops of A@PEG20k in cell culture at 300 kHz. (b) Experimental SAR versus field curves of A@PEG20k at 149, 300, and 671 kHz. (c) Calorimetric measurements in vitro and calculated SAR for initial slope. AC Magnetometry on cells have been performed by AC Magnetometer-1, calorimetry on cells and hyperthermia treatment in vitro have been carried out by a homemade electromagnetic applicator (see Materials and Methods). (d) Representative optical micrographs taken at 24 and 48 h posthyperthermia for the different nanoparticle concentrations used (C1 = 0.25 mgNPs/ml and C2 = 0.5 mgNPs/ml), scale bars 100 μm. (e) Hyperthermia survival was quantified by plotting the relative growth of cells 24 and 48 h posthyperthermia treatment. Growth rates were plotted as relative values compared to the 24 h control (water). (f) Gene expression analysis of apoptotic genes BCL10 and CASP8 in cells incubated with C1 and exposed to magnetic field. RNA was extracted from the cells after incubation for 24 and 48 h posthyperthermia. Expression was calculated relative to the housekeeping gene RPLP0. Values are represented as the mean and standard error of the mean of three independent experiments. **p < 0,01; paired Student’s t test.

