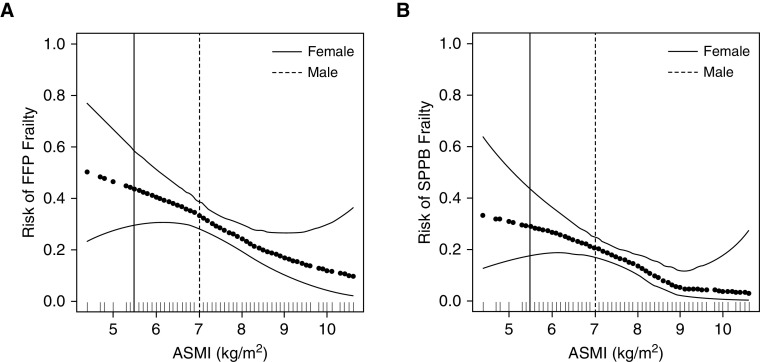
Figure 2.
(A and B) Risk of frailty by Fried frailty phenotype (FFP) (A) and short physical performance battery (SPPB) (B) by appendicular skeletal muscle mass index (ASMI). Generalized additive models; horizontal dark dotted black line represents the effect estimates. Surrounding thin lines represent 95% confidence bands. Full-height solid and dashed vertical lines represent sex-specific ASMI cut-points for sarcopenia diagnosis. Each vertical line in the rug plot along the x-axis represents a single study subject. Models are adjusted for age, sex, and diagnosis.

