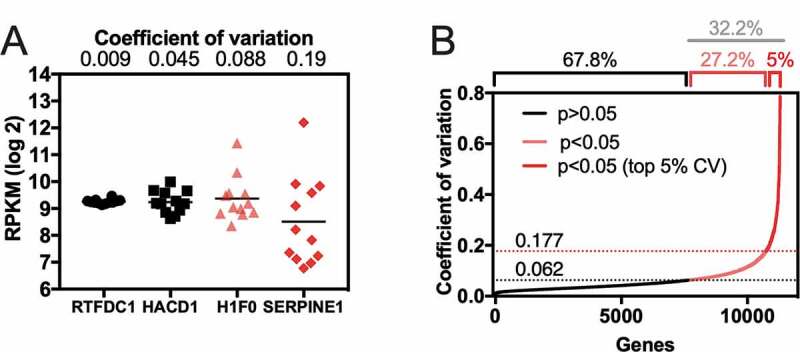
Figure 2.

Expression variability of the heart transcriptome among individuals. (A) Example of expression variation of four genes with a variation coefficient ranging from low (0.009, RTFDC1) to high (0.19, SERPINE1). The expression of those genes was measured by RNA-seq and plotted as reads per kilobase per million (RPKM). (B) Cumulative distribution plot of the coefficient of variation values obtained from a healthy human heart left ventricles (12 individuals). Values of CV higher than 0.062 (dotted black line) were considered statistically different (p < 0.05) when compared with the average CV from housekeeping genes (see details in methodology). The top 5% higher CV genes have CV values higher than 0.177 (dotted red line)
