
Figure 3.
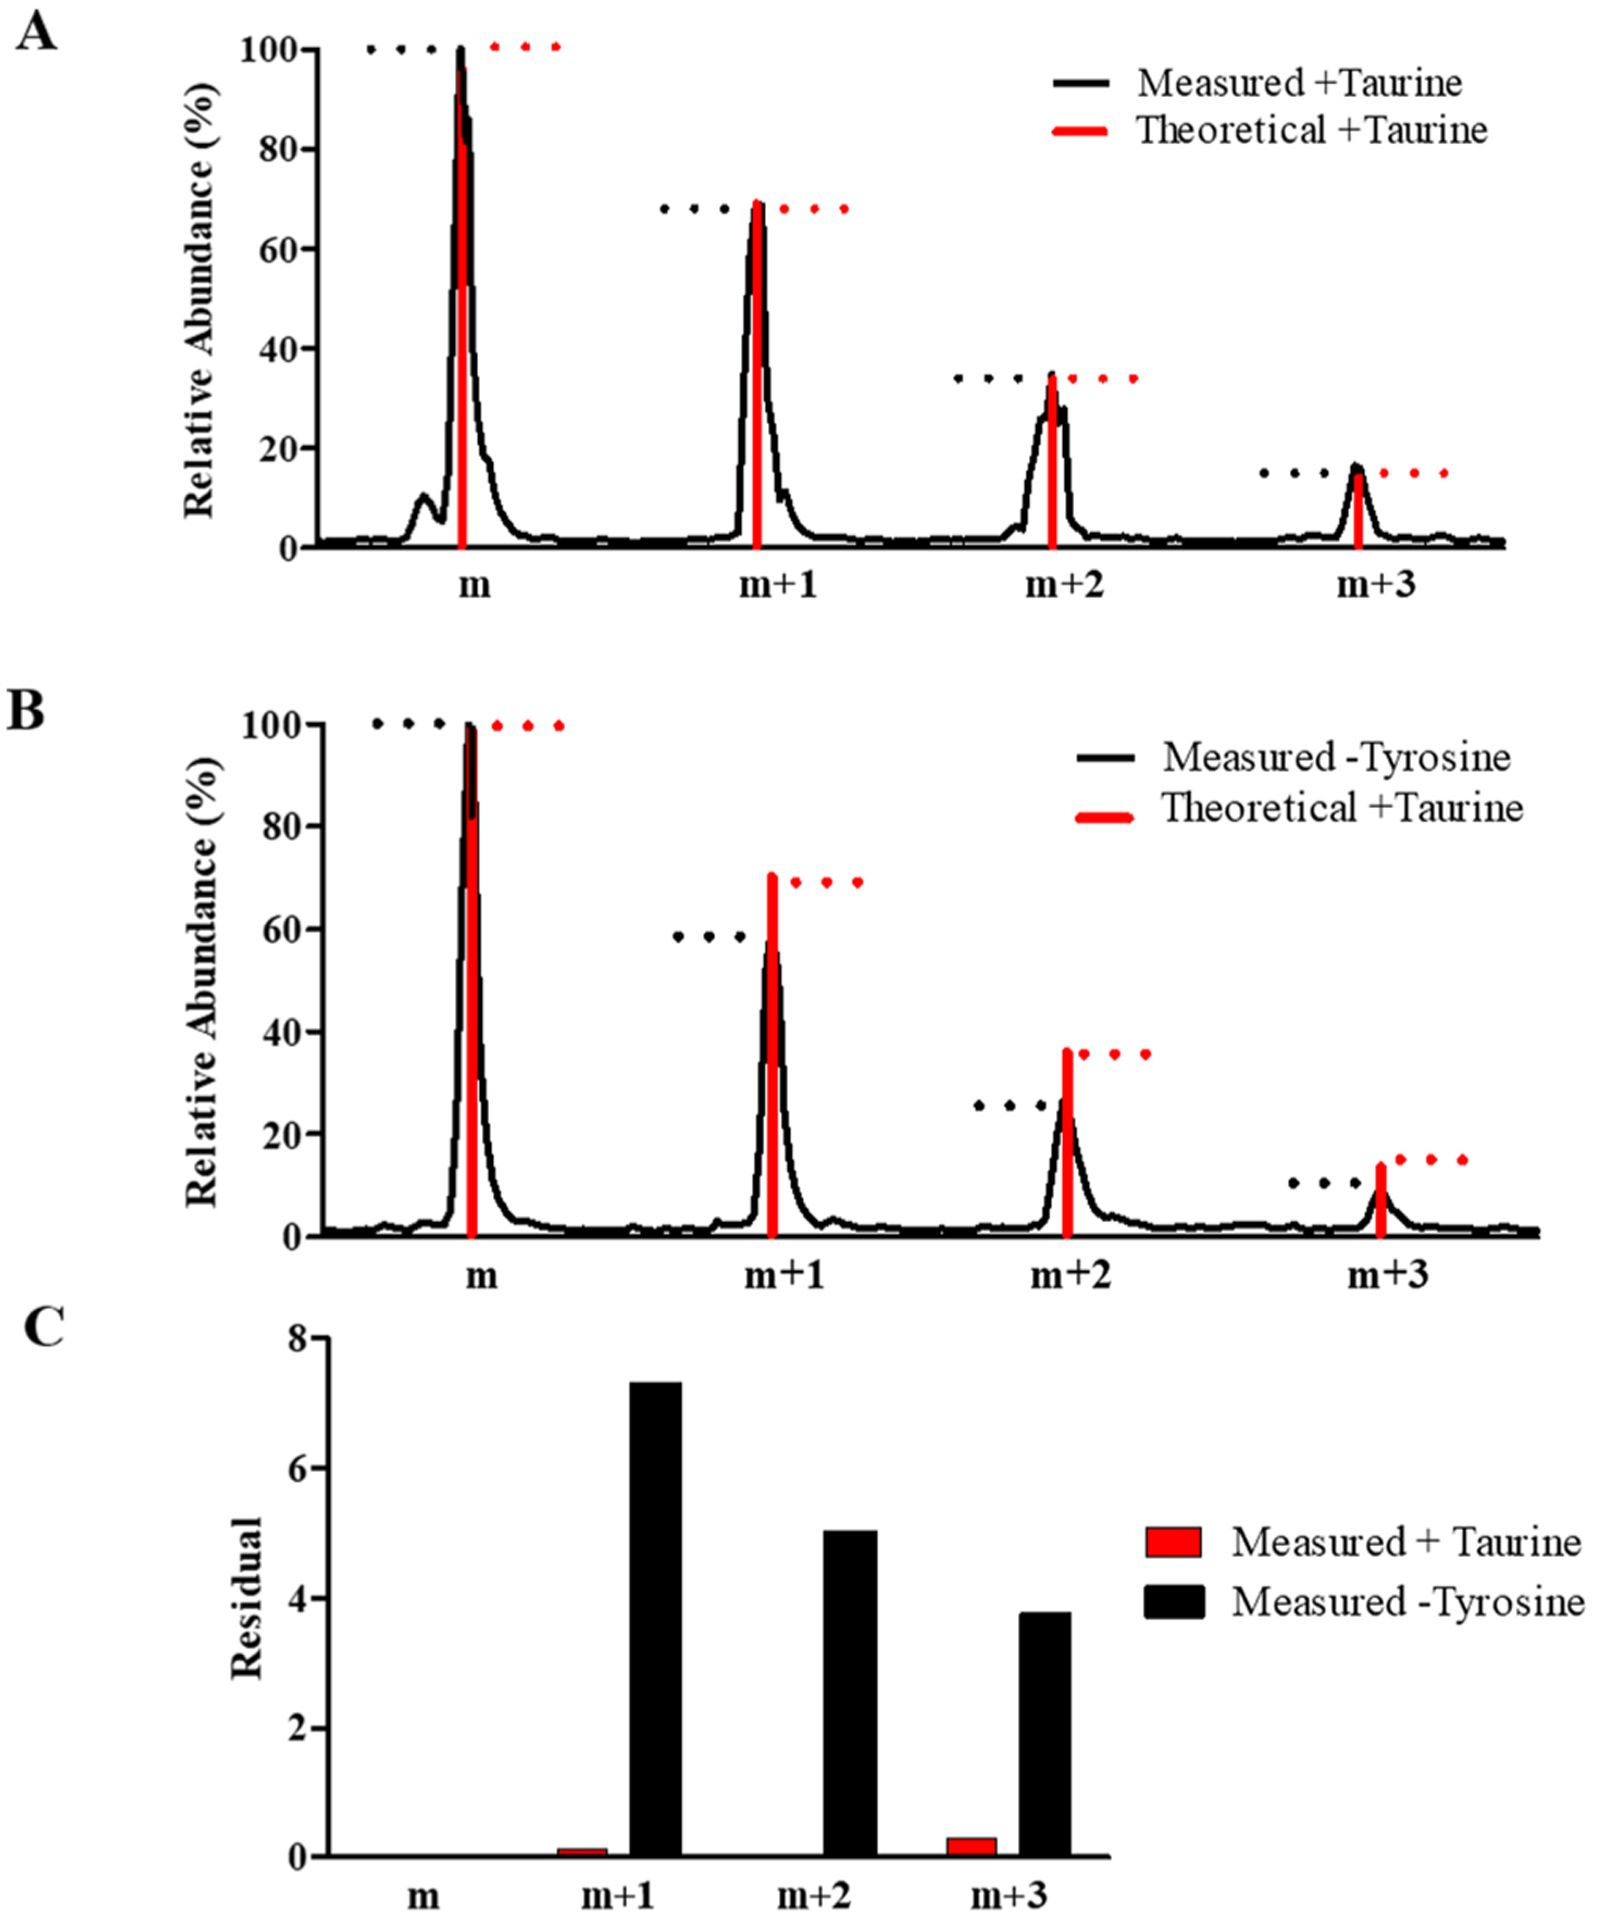
Isotopic cluster and residual plot analysis for AspN-digested de-tyrosinated and taurinated CT peptides of α1 tubulin. (A) Comparison of the measured and theoretical isotopic clusters for the measured taurinated peptide (DSVEGEGEEEGEE + taurine, m/z 749.2520). (B) Comparison of the isotopic clusters from the measured de-tyrosinated peptide (DSVEGEGEEEGEE-Y, m/z 695.7468) and theoretical isotopic clusters from the taurinated peptide. Dashed lines in (A) and (B) represent peak maxima for the measured (black) and theoretical (red) isotopes. (C) Residual plot for the isotopic clusters in (A) and (B).