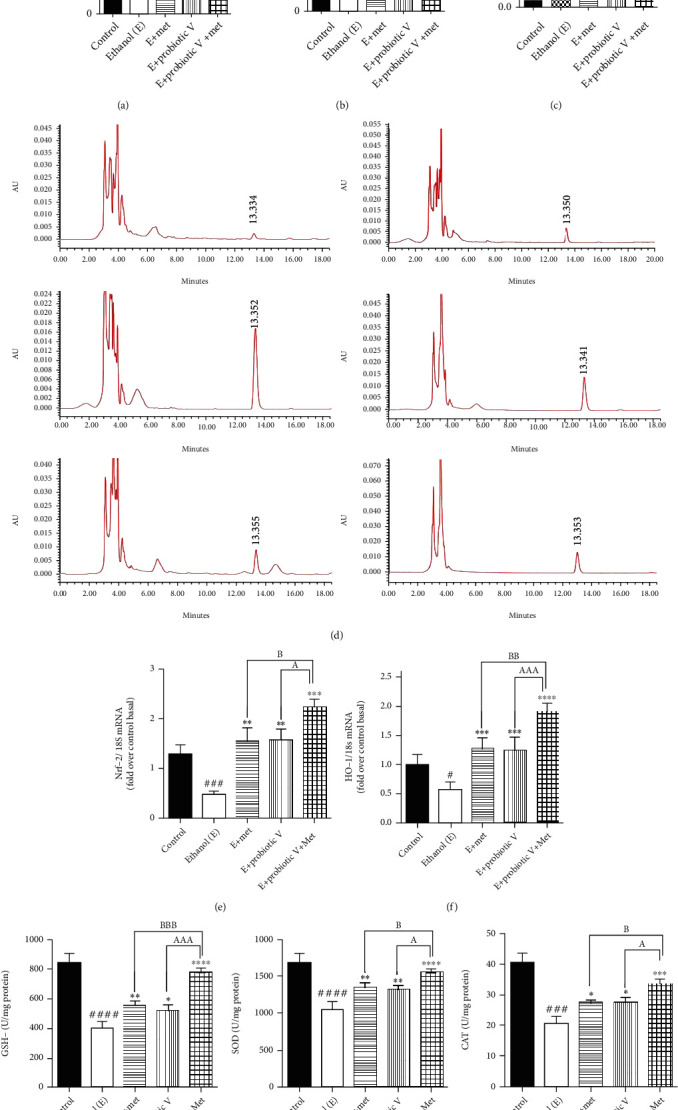
Figure 5.

Probiotic V and Met unaided or in combination prevent ethanol-mediated ROS production and oxidative stress in ethanol-induced intestinal injury. (a) Fluorescence spectroscopy with excitation/emission wavelengths at 485 nm/525 nm after incubation with carboxy-H2-DCFDA. (b) Total serum MDA levels. Here, the MDA levels in serum were quantified with reference to the standard area under the curve (AUC). (c) Total MDA concentration in colon tissue. The MDA content was quantified using the TBA assay method. (d) HPLC chromatograms of total serum MDA after DNPH derivatization in (a) standard, (b) control, (c) ethanol-fed, (d) Met (75 mg/kg) + ethanol-fed, (e) probiotic V (108 CFU/day) + ethanol-fed, and (f) probiotic V (108 CFU/day) + Met (75 mg/kg) + ethanol-fed rats. The amount of MDA present in serum was estimated after processing and DNPH derivatization. The serum sample after derivatization was then analyzed by a Shimadzu HPLC instrument using a fully end-capped spherical ODS2 C18 reverse-phase HPLC column. For the mobile phase, acetonitrile-distilled water with a ratio of 38 : 62 consisting of 0.2% glacial acetic acid was used. Colonic expression of antioxidants (e) Nrf-2, (f) HO-1, (g) GSH-Px, (h) SOD, and (i) CAT. The gene expression levels were measured after normalizing against 18S. Values are expressed as mean ± SD of six rats. Statistical analysis: one-way ANOVA followed by Tukey's post hoc test. #p < 0.05, ###p < 0.001, and ####p < 0.0001 compared to the control group; ∗p < 0.05, ∗∗p < 0.01, ∗∗∗p < 0.001, and ∗∗∗∗p < 0.0001 compared with the ethanol-fed group; ap < 0.05, aaap < 0.001, and aaaap < 0.0001 compared with the E + probiotic V group; bp < 0.05, bbp < 0.01, and bbbp < 0.001 compared with the E + Met group.
