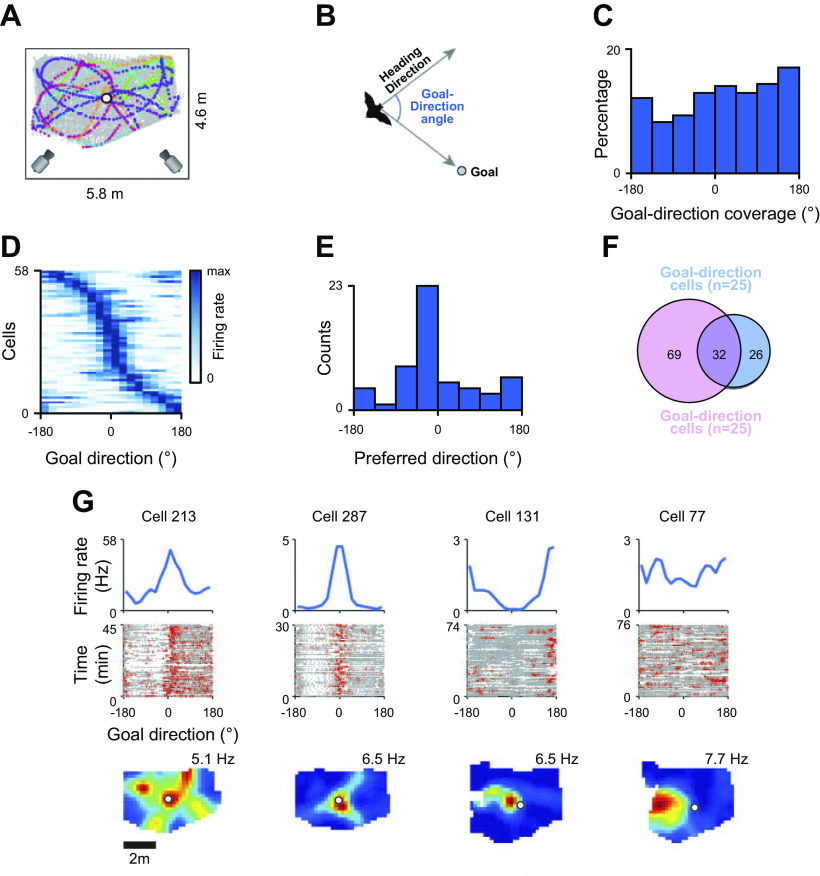
FIGURE 7.
Goal-direction cells in the bat. A: schematic of the testing arena used for studying bat goal-direction cells together with typical flight patterns relative to the goal (circle). B: polar coordinate system, with heading direction to the goal as the 0° angle. C: during flight, bats headed in most directions relative to the goal. D–F: 19% of cells had significant directional heading vectors relative to the goal, of which 40% were heading toward the goal and 60% in other directions (D and E), and 55% also had a place correlate (F). G: examples of a pure directional cell (left), 2 place × directional cells (center), and a pure place cell (right). From Ref. 51, with permission from Science.

