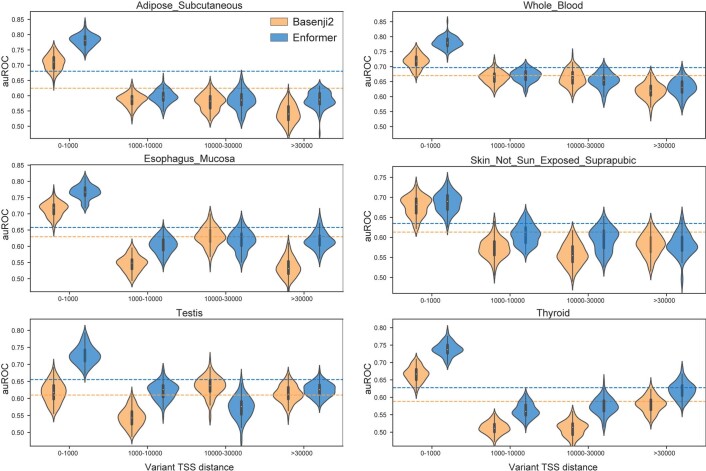
Extended Data Fig. 10. Enformer outperforms Basenji2 on eQTL sign prediction.
For each of the GTEx tissues, we manually matched FANTOM5 CAGE sample descriptions to choose a single matched dataset (Methods). We then arranged a classification task to discriminate between fine-mapped causal eQTLs in which the minor allele increases gene expression versus eQTLs in which the minor allele decreases gene expression. We computed auROC statistics by ranking causal variants by their signed prediction for the corresponding sample. To consider the influence of variant distance to TSS, we compute auROC in four bins of roughly equal size. Across tissues and TSS distances, Enformer predictions usually achieve more accurate classification of eQTL sign than Basenji2 predictions. We display six example tissues with large numbers of fine-mapped eQTLs and with clear correspondence between CAGE and GTEx tissues. Violin plots show the auROC distribution of 100 bootstrap samples from the full set of variants. (The white dot represents the median, the thick gray bar in the center represents the 25%-75% percentile range and the thin line represents the entire data range.) Dashed lines represent the mean auROC over all distances. Both models struggle with variants beyond the promoter (TSS distance > 1,000), highlighting an important problem for future research.

