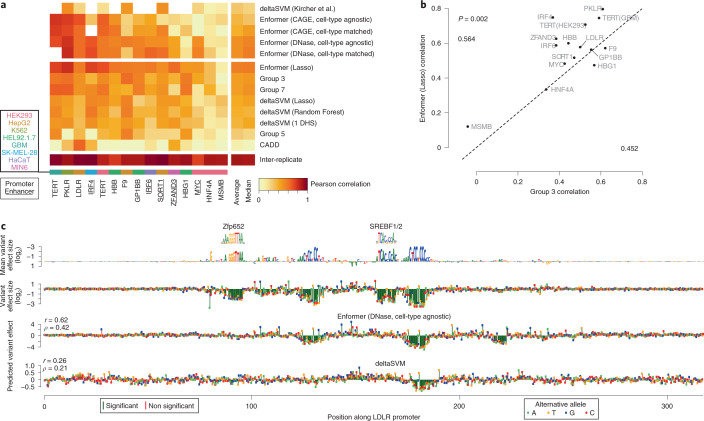
Fig. 4. Enformer improves noncoding variant effect prediction as measured by saturation mutagenesis experiments.
a, Correlation of variant effect predictions with experimental values, as measured by saturation mutagenesis MPRAs25, on test sets for 15 loci curated for the CAGI5 competition26. Shown above the horizontal break is the performance of five methods that required no additional fine-tuning on each locus; shown below is that of eight methods that were additionally trained on the CAGI5 training sets. b, Pearson correlations of each locus for predictions derived from the Enformer versus the winning team of the CAGI5 competition. Average performance for each model is shown in the corners. Enformer shows a significant performance improvement (P = 0.002, paired, one-sided Mann–Whitney U test). c, Example saturation mutagenesis data from the LDLR promoter locus. Shown in the top row is the reference sequence scaled to the mean effect size among all alternative mutations, with measured effect sizes of individual variants in the second row. Two of the four significant elements match known motifs39, and the two unknown motifs partially resemble the SP1 binding motif. Shown in the bottom two rows are the predictions on the full dataset using methods from a that required no additional fine-tuning.

