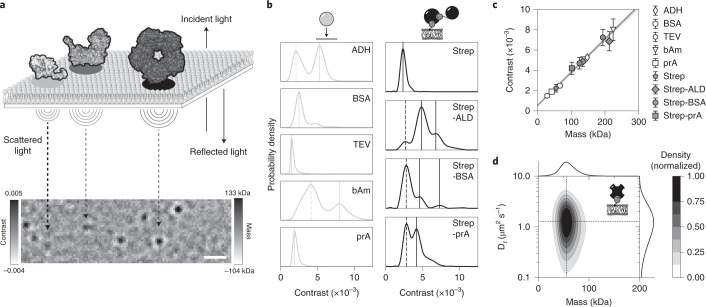
Fig. 1. Principle of MSPT.
a, Schematic displaying the iSCAT-based measurement principle of MSPT. Exemplary structures of three aldolase oligomer states (PDB 4S1F, ref. 51) are shown in the top panel, and their respective iSCAT images at the bottom. Scale bar, 1 µm. b, Probability density distributions of standard proteins determined using the conventional mass photometry landing assay (left) or using MSPT (right). All data represent pooled distributions of three independent experiments per condition: alcohol dehydrogenase (ADH) (particle number n = 9,828), BSA (n = 11,408), TEV protease (TEV) (n = 1,705), β-amylase (bAm) (n = 10,043), protein A (prA) (n = 12,720); divalent streptavidin (Strep) (n = 16,699 trajectories), divalent streptavidin with biotinylated aldolase (Strep-ALD) (n = 16,727 trajectories), divalent streptavidin with biotinylated BSA (Strep-BSA) (n = 8,842 trajectories) and divalent streptavidin with biotinylated protein A (Strep-prA) (n = 22,424 trajectories). Dashed lines mark peaks not considered for mass calibration (left). Continuous lines represent oligomer states included in the mass calibration. Two-dimensional plots of mass versus diffusion coefficient for the four proteins measured with MSPT (right) are shown in Supplementary Fig. 4. c, Comparison of the contrast-to-mass calibration for mass photometry and MSPT, derived from peak contrasts in b and their assigned sequence masses (Supplementary Tables 2 and 3). Error bars represent the standard error of the peak locations estimated by bootstrapping. d, Two-dimensional KDE of 1.25 nM tetravalent streptavidin bound to biotinylated lipids on a SLB (n = 73,901 trajectories of three independent replicates; particle density: 0.2 µm−2). Marginal probability distributions of the molecular mass (top) and the diffusion coefficient (right) are presented.

