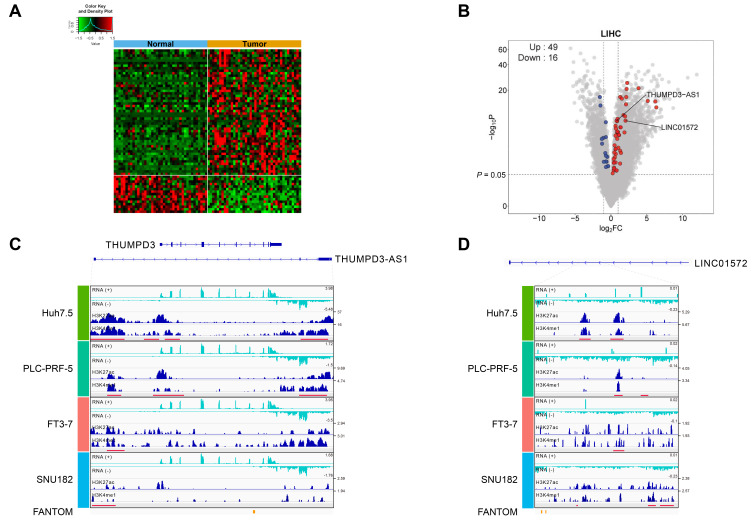
Fig. 2. Characteristics of the 132 putative eRNAs.
(A) Heat map constructed after comparing the 132 putative eRNAs to the list of DEGs from the TCGA-LIHC dataset. A total of 65 out of the 132 eRNAs overlapped with the DEGs estimated by comparing gene expression between normal and tumor samples from the TCGA-LIHC dataset (P < 0.05), and 49 and 16 eRNAs were found to be upregulated and downregulated, respectively, in tumor tissues. (B) A volcano plot of the DEGs estimated from the TCGA-LIHC dataset in (A). All the DEGs (gray), 49 upregulated eRNAs (red), and 16 downregulated eRNAs (blue) are depicted accordingly. (C and D) Integrative Genomics Viewer (IGV) views showing the genomic locations of ChIP-seq signals and RNA-seq data estimated in the four different hepatocellular cell lines for the two selected eRNAs, THUMPD3-AS1 (C) and LINC01572 (D). The red bars in the figure boxes indicate putative enhancer regions where the two active chromatin peaks are located.

