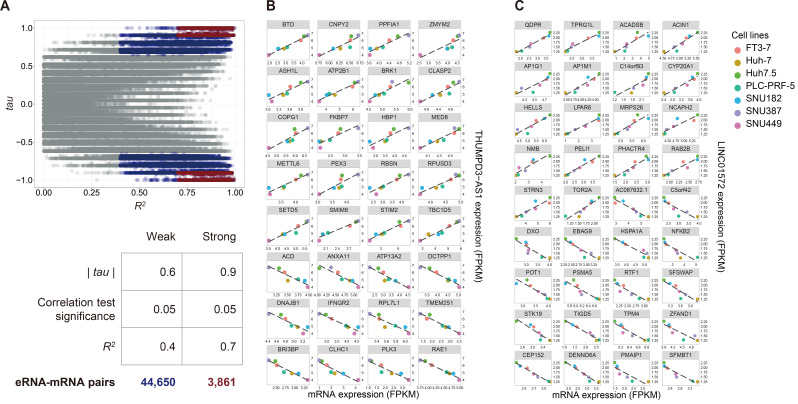
Fig. 3. Example correlations of putative eRNAs and their target mRNAs.
(A) Scatter plot of R 2 and Kendall’s tau values. The relationship between each of the 132 eRNAs and each of 7,763 mRNAs was investigated using Kendall’s tau correlation analysis and linear regression analysis. A scatter plot was then constructed for all the R 2 and Kendall’s tau values estimated from the two analyses. The x-axis represents the R 2 values estimated by the linear regression analysis, and the y-axis represents tau values calculated by Kendall’s tau correlation test. Two thresholds were set to determine putative mRNA targets, as shown in the table below (A), i.e., the weak targets (colored blue on plot A) were identified by R 2 > 0.4, |tau| > 0.6, and P < 0.05, and the strong targets (colored red on plot A) were identified by R 2 > 0.7, |tau| > 0.9, and P < 0.05. (B) Example scatter plot of THUMPD3-AS1 and its 32 putative strong target mRNAs. (C) Example scatter plot of LINC01572 and its 36 putative strong targets.

