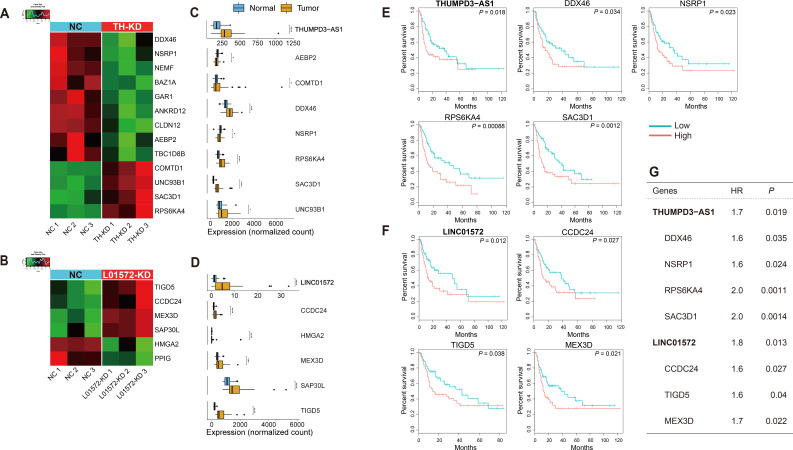
Fig. 5. Two putative eRNAs and their validated mRNA targets involved in patient survival.
(A and B) Heat map of the putative target mRNAs overlapping with the lists of the two eRNA KD experiments: (A) putative target mRNAs overlapping with the list of DEGs generated in the THUMPD3-AS1 KD experiment and (B) putative target mRNAs overlapping with the list of DEGs generated in the LINC01572 KD experiment. NC, negative control; TH-KD, THUMPD3-AS1 KD; L01572-KD, LINC01572 KD. (C and D) Boxplots of the expression values of eRNAs and their target mRNAs estimated with the TCGA-LIHC dataset: (C) expression values of THUMPD3-AS1 and its target mRNAs and (D) expression values of LINC01572 and its target mRNAs. *P ≤ 0.05; **P ≤ 0.01; ***P ≤ 0.001; ****P ≤ 0.0001. (E and F) Kaplan–Meier plots of the two eRNAs and their validated target mRNAs. Note that the validated target mRNAs were defined as those eRNA-target mRNA pairs that were confirmed in the analysis in (A-D); (A) and (C) show the THUMPD3-AS1 results, and (B) and (D) show the LINC01572 results. Survival analysis was performed using the clinical information of the TCGA-LIHC dataset (see Materials and Methods section). (G) Table of the hazard ratios (HR) and P values of each gene identified by Cox regression analysis.

