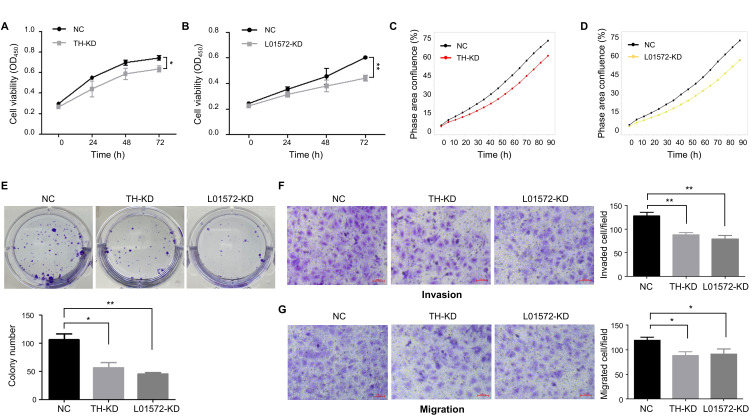
Fig. 6. Roles of the two putative eRNAs in cancer progression.
(A and B) CCK-8 assays were conducted to assess cell viability at the indicated time points: (A) THUMPD3-AS1 KD and (B) LINC01572 KD. OD, optical density; NC, negative control; TH-KD, THUMPD3-AS1 KD; L01572-KD, LINC01572 KD. (C and D) IncuCyte proliferation assays were carried out to determine cell viability at the indicated times: (C) THUMPD3-AS1 KD and (D) LINC01572 KD. The graph shows the mean values of technical triplicates. (E) Representative images of colony formation assays. (F and G) Representative images of transwell assays: (F) invasion assays and (G) migration assays. Scale bars = 100 µm. All data were obtained from at least three independent experiments, and P values were determined by two-tailed unpaired t-test analysis. *P ≤ 0.05; **P ≤ 0.01.

