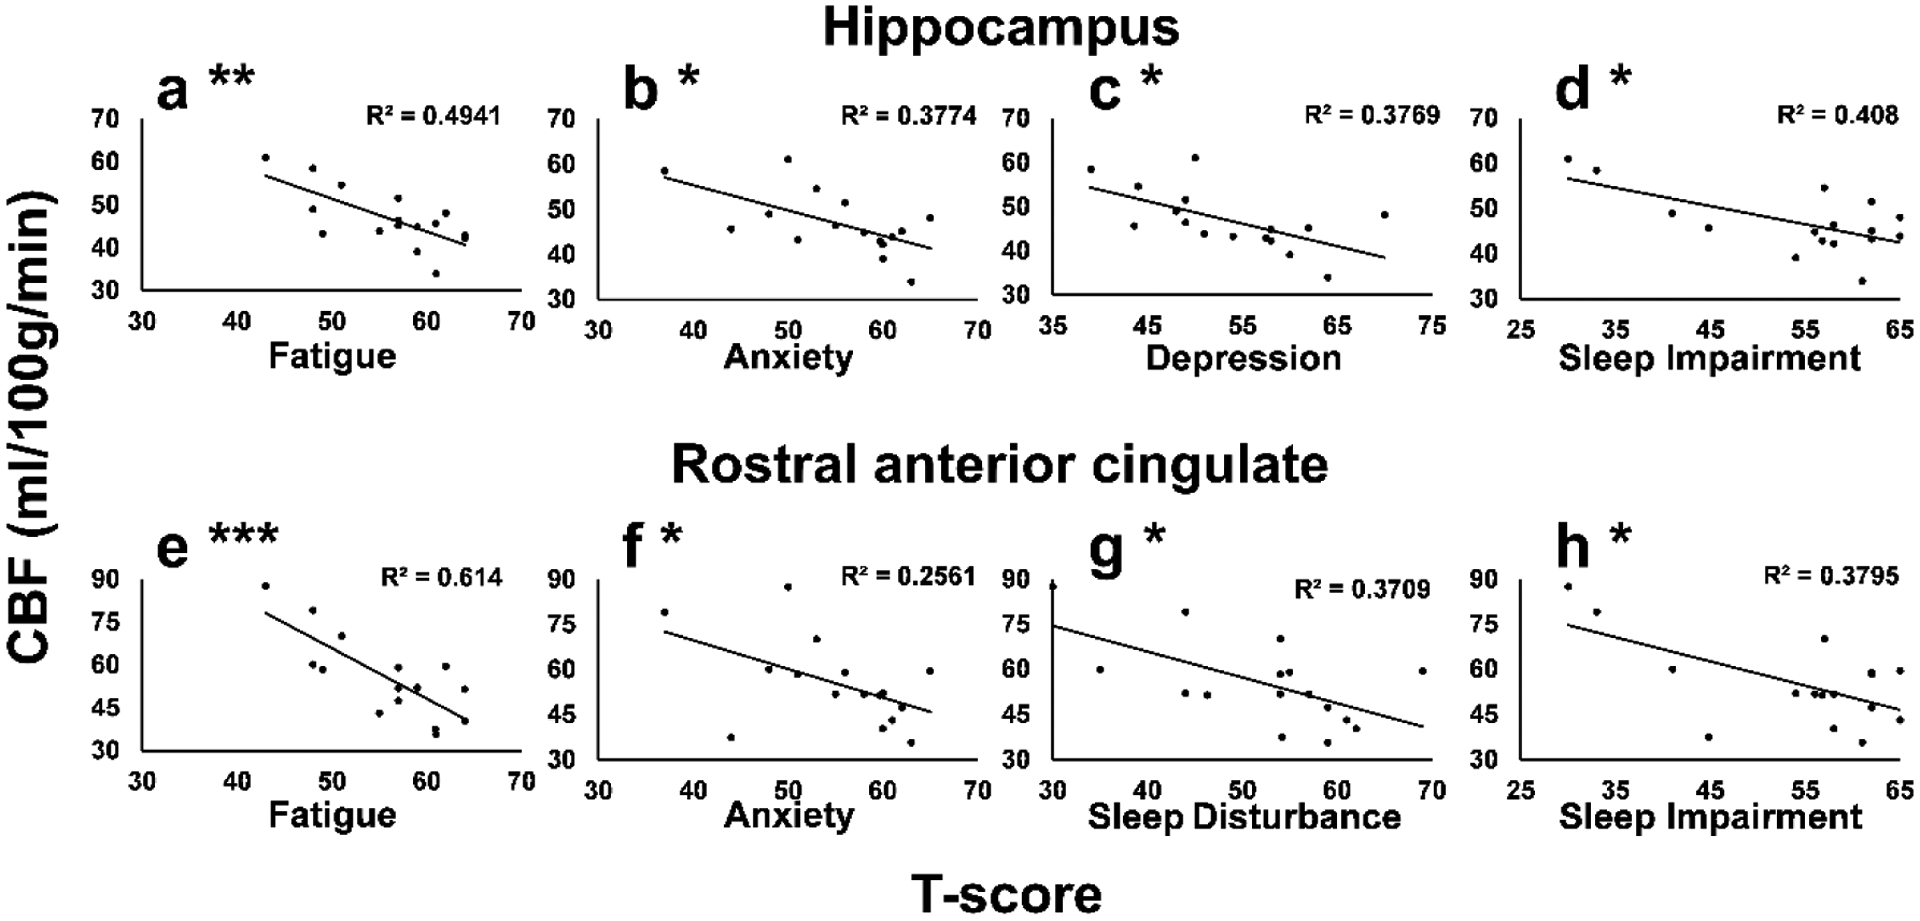
Figure 3.

Negative correlation between hippocampus ROI CBF (a – d) and TBI-related symptoms of (a) Fatigue (p=0.002), (b) Anxiety (p=0.01), (c) Depression (p=0.01), and (d) Sleep Impairment (p=0.008) and negative correlation between rostral anterior cingulate cortex ROI CBF (e – h) and TBI-related symptoms of (e) Fatigue (p=0.0003), (f) Anxiety (p=0.045), (g) Sleep Disturbance (p=0.01), and (h) Sleep Impairment (p=0.01). TBI-related symptoms are reported as T-scores; significant correlations are denoted as: * p<0.05; ** p<0.005; *** p<0.0005
