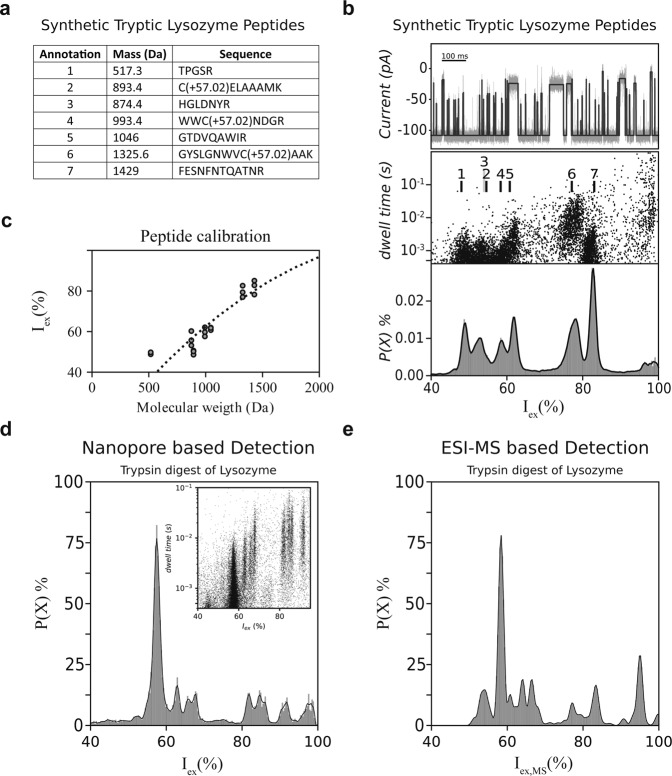
Fig. 2. Lysozyme fingerprinting using FraC-G13F-T1 nanopores.
a Peptides expected from lysozyme’s tryptic digest including their mass. The additional mass of 57.02 Da is expected for alkylated peptides at a cysteine position. b Ionic current versus time (top), Iex(%) versus dwell time (middle) and probability density (bottom) versus Iex(%) as obtained from the measurement of an equimolar mixture of the peptides expected from Gallus-gallus lysozyme. The black lines in the top panel indicate the fitted event. c Mass of model peptides from tryptic Gallus-gallus lysozyme (gray spheres) set against the measured excluded current (%), based on 3 individual measurements. The black dotted line represents a polynomial fit through the data. d Excluded current spectrum density from the tryptic digest of Gallus-gallus lysozyme. The inset shows the dwell time versus Iex(%) spectrum. e Constructed Iex% spectrum density from the same tryptic digest of Gallus-gallus lysozyme analysed by ESI-MS. Each peak indicates a peptide identified by ESI-MS, with Iex% calculated using the calibrated exclusion current % in b. The height of the peak reflects the relative abundance of peptides measured by ESI-MS. The spread of the peak indicates an arbitrary standard deviation of 0.5 Iex%. All nanopore measurements were performed in 1 M KCl buffered to pH 3.8 using 50 mM citric acid titrated with bis-tris-propane under an applied potential of −70 mV. Recording was performed at 50 kHz using an analog Bessel-filter at 10 kHz and a digital Gaussian filter of 5 kHz. Source data are provided as a Source Data file.

