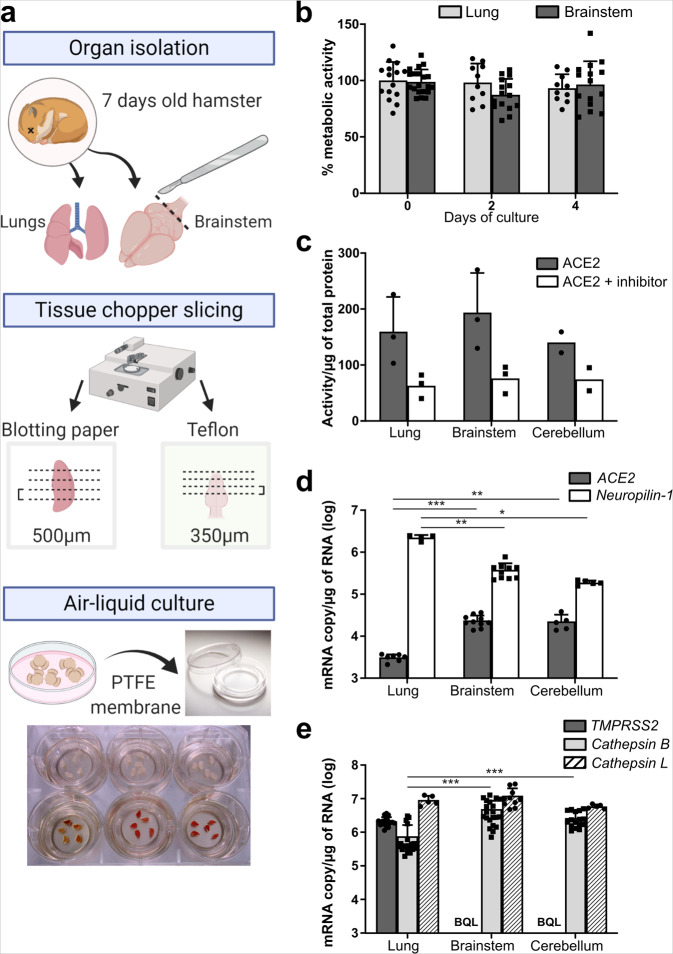
Fig. 1. Characterization of the lung and brainstem organotypic cultures.
a Schematic representation of the generation of hamster organotypic cultures. b Cellular metabolism activity over time in % of day 0 of culture, quantified by the Alamar blue assay. (n = minimum 10 biologically independent animals). c ACE2 activity quantified with the fluorometric ACE2 Activity Assay Kit. (n = 3 biologically independent animals). d ACE2 and Neuropilin-1 basal mRNA expression (n = minimum five biologically independent animals) and eTMPRSS2, Cathepsin B, and Cathepsin L basal mRNA expression in the models quantified by RT-qPCR (day 0 of culture). (n = minimum 12 biologically independent animals). BQL below the quantification limit, ACE2 angiotensin-converting enzyme 2, PTFE polytetrafluoroethylene. Error bars represent SD. Statistical analyses were performed using the Kruskal–Wallis test. *P < 0.05; **P < 0.01; ***P < 0.001 Source data are provided as a Source Data file.

