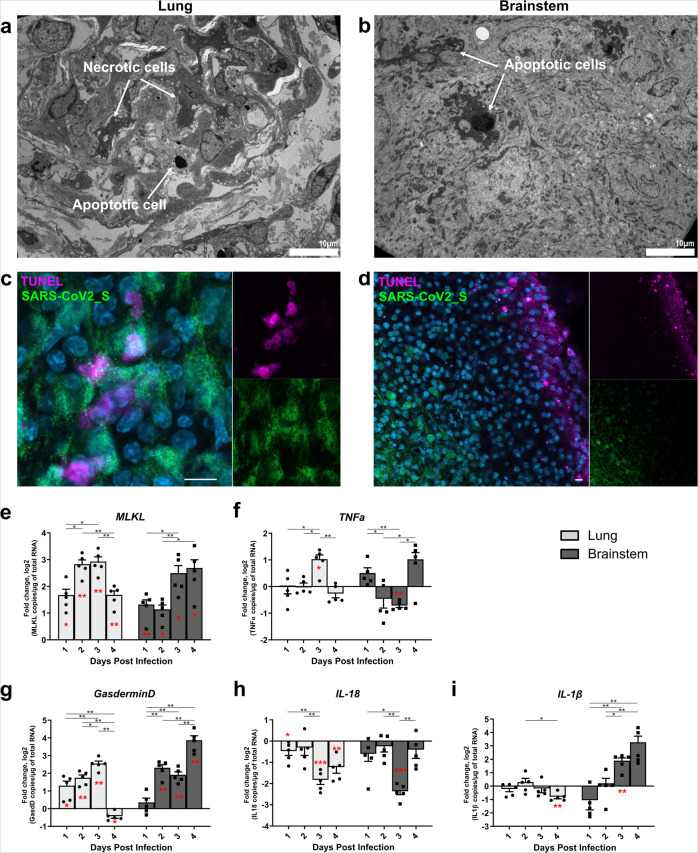
Fig. 6. Cell death in the ex vivo cultures.
Hamster ex vivo cultures were infected with 1000 pfu of SARS-CoV-2 (n = 5 biologically independent animals). a–c Lung and brainstem slices were fixed at 1 day post infection (dpi) or 2 dpi, respectively. a, b Transmission electron microscopy analysis showing necrotic cells and apoptotic cells, scale bar is represented bottom right on each picture. c, d SARS-CoV-2_S protein immunostaining, and terminal deoxynucleotidyl transferase dUTP nick end labeling (TUNEL) labeling in the lung and brainstem. Nuclei were counterstained with DAPI. e–i mRNA expression level of e MLKL, f TNF-α, g Gasdermin D, hIL1β, and i IL-18 over time. mRNA copies per µg of total RNA were quantified by RT-qPCR and normalized to the variation of the amounts of GAPDH mRNA. Fold changes are relative to the number of copies of mRNAs in infected organotypic cultures compared to the uninfected ones. Error bars represent SD. Statistical analyses were performed using the Mann–Whitney test two-sided to compare the fold changes between days of culture (black stars). mRNA expression levels in infected samples were also compared with non-infected samples at the corresponding time point (red stars) using the one-sample T-test. *P < 0.05; **P < 0.01; ***P < 0.001. Scale bar 10 µm. Source data are provided as a Source Data file.

