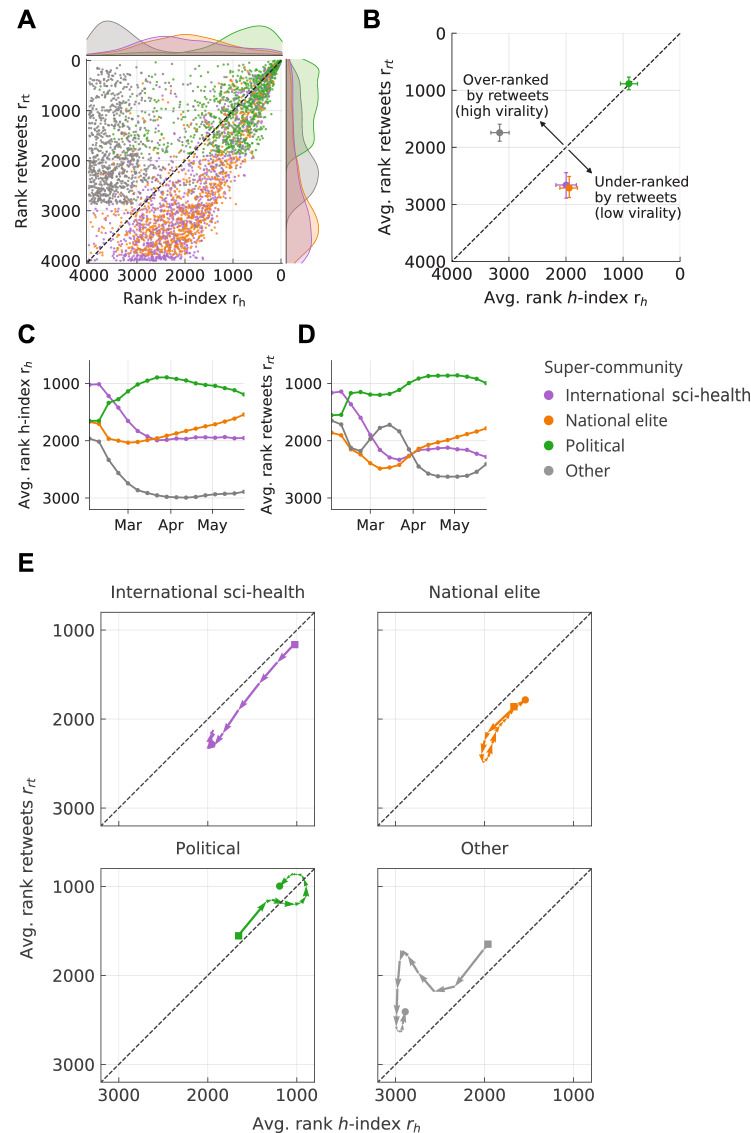
Figure 5.
Static and temporal communication patterns of the top 1000 users of each super-community. (A) Comparison between the rank in terms of h-index and retweets by user, as well as respective marginal distributions. (B) The average rank by super-community with bootstrapped 95% confidence intervals. (C) Weekly h-index rank computed within a rolling time window of 1 month. (D) Weekly rank in retweets computed within a rolling time window of 1 month. (E) Vector plot of retweet and h-index ranks by super-community. Each arrow denotes the change in ranks within one week. The first and last week are marked with a square and circle, respectively.

