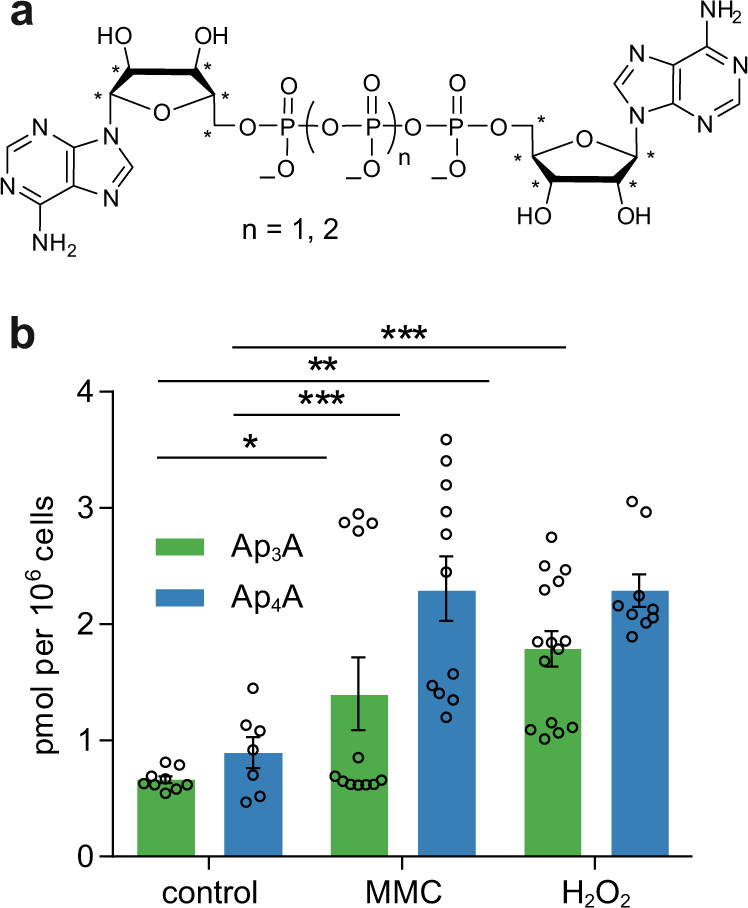
Fig. 2. Determination of Ap3A and Ap4A levels in HEK293T cell lysates.

a Chemical structures of 13C-labeled 13C10-Ap3A (n = 1) and 13C10-Ap4A (n = 2) used as internal standards. b Obtained Ap3A (green) and Ap4A (blue) levels of stressed and unstressed (control) HEK293T cells. For each condition 15 biological replicates were performed. Samples were measured in technical duplicates and averaged. Measurements with a signal to noise ratio below 7 were excluded. Data presented are mean ± standard error of the mean (SEM); n (control, Ap3A) = 9, n (control, Ap4A) = 7, n (MMC, Ap3A) = 12, n (MMC, Ap4A) = 11, n (H2O2, Ap3A) = 15, n (H2O2, Ap4A) = 9. Significant differences were determined by one-way ANOVA in combination with the Dunnett test (*p ≤ 0.05; **p ≤ 0.01; ***p ≤ 0.001). Source data are provided as a Source Data file.
