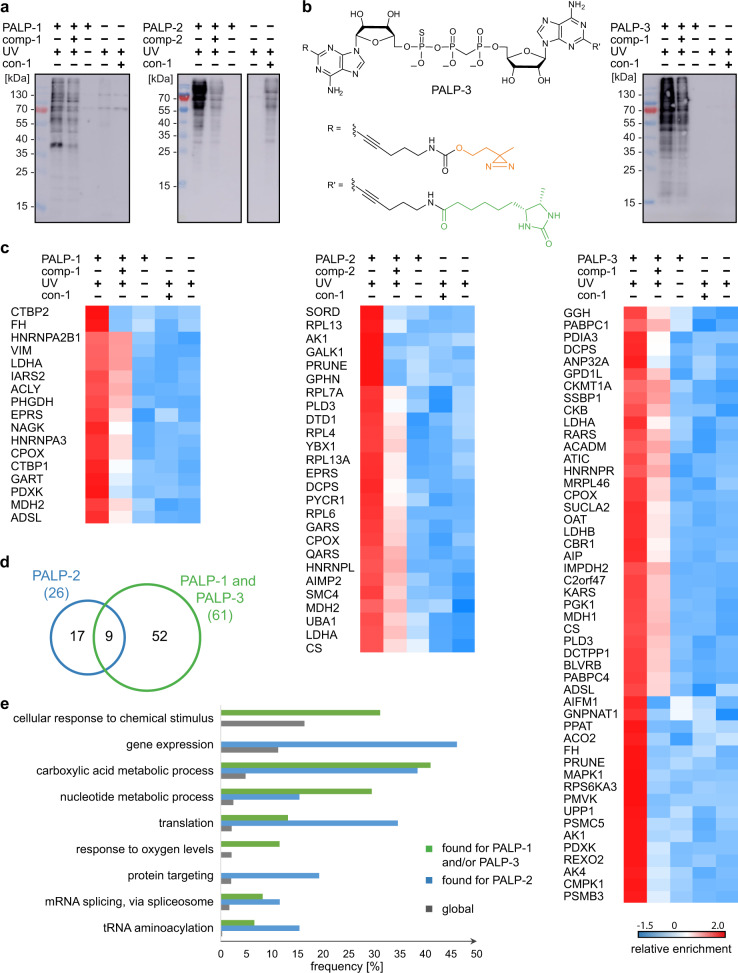
Fig. 3. Overview of the proteomic analysis of the PAL experiments using HEK293T cell lysates.
a Western blot analysis with ExtrAvidin®-Peroxidase showing the enrichment of labeled proteins under optimized conditions using PALP-1 (left) and PALP-2 (right) as indicated after irradiation with UV light (365 nm) for 5 min. b As for a but usage of PALP-3. Structure of PALP-3 is shown. c Heat map representation (Z-scores) of proteins that were quantified in the respective experiments in at least four out of six measurements and that passed a one-way ANOVA-based multiple-sample test for statistically significant enrichment, with a permutation-based false discovery rate (FDR) below or equal to 0.01 and S0 value set to 0.2, followed up by two-sided post hoc Tukey’s HSD test (FDR ≤ 0.05) to filter for significant enrichment against all performed control experiments. d Venn diagram showing the distribution of identified proteins for Ap3A probes (data obtained with PALP-1 and PALP-3, green) and the Ap4A probe (data obtained with PALP-2, blue). e Extract of biological processes that are significantly overrepresented in proteins found with Ap3A-based probes (PALP-1 and PALP-3, green) and the Ap4A-based probe (PALP-2, blue) compared to the global human proteome (gray) according to GO analysis using a one-sided hypergeometric test performed with the Cytoscape BiNGO app (Supplementary Data 2). Global frequency represents the number of genes annotated to a GO term in the entire human proteome, while sample frequency represents the number of genes annotated to that GO term in the protein list obtained by the presented PAL approaches. Source data are provided as a Source Data file.

