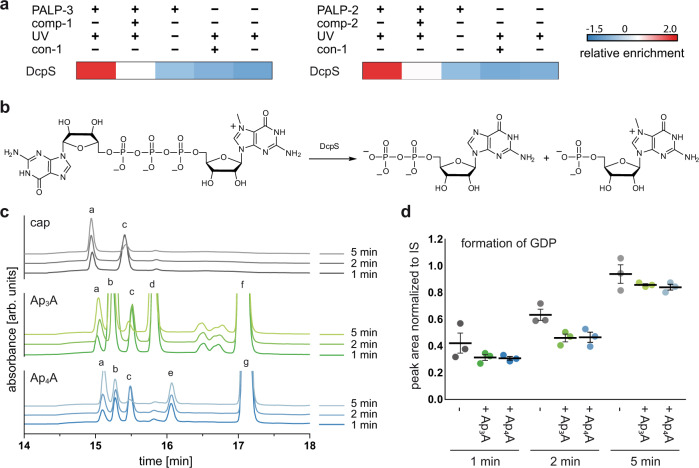
Fig. 4. Investigation of the interaction of ApnAs with DcpS.
a Extract of ANOVA-heatmap (Z-scores) for DcpS under different PAL conditions. b DcpS catalyzed cleavage of m7Gp3G. c Excerpt of the HPLC profiles for the hydrolysis of m7Gp3G (peak c) catalyzed by DcpS. The initial substrate concentration was 20 µM and the reactions were carried out in the absence (gray) or presence of Ap3A (green) and Ap4A (blue) (200 µM) at an enzyme concentration of 100 nM. Absorbance was measured at 260 nm (arb. units, arbitrary units). Formation of GDP (peak a) can be observed for all reactions. For Ap3A (peak f), ADP (peak b) and AMP (peak d) were identified as hydrolysis products. By analogy, AMP (peak d) and ATP (peak e) were identified as the cleavage products of Ap4A (peak g). The chromatographic peaks were identified by comparison with the retention times of reference samples and by subsequent MS analysis. d Quantification of the cleavage product GDP at different time points, applying adenosine as internal standard (IS). Data presented are mean ± SEM, n = 3 biologically independent experiments. Source data are provided as a Source Data file.

