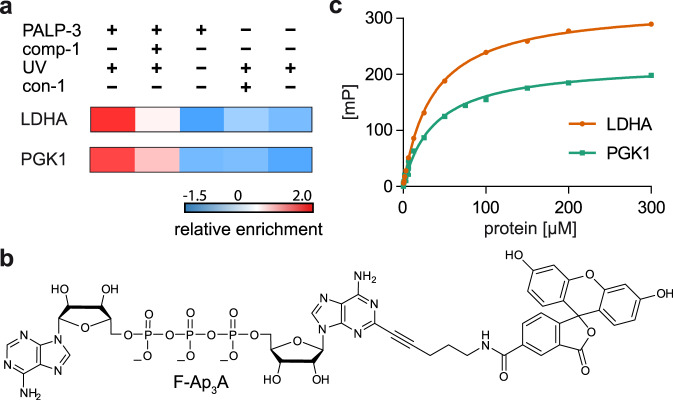
Fig. 6. Investigation of the binding affinity of LDHA and PGK1 to the fluorescent labeled Ap3A analog F-Ap3A via fluorescence polarization (FP).
a Extract of ANOVA-heatmap (Z-scores) for LDHA and PGK1 under different PAL conditions. b Chemical structure of F-Ap3A. c FP-based quantification of binding between LDHA (orange) or PGK1 (green) to F-Ap3A. Increasing concentrations of protein were incubated with F-Ap3A (25 nM) for 15 min on ice and 30 min at 30 °C before measurement. FP values were determined and plotted against the protein concentrations. Data presented are mean ± SD, n = 3 technical replicates. Source data are provided as a Source Data file.

