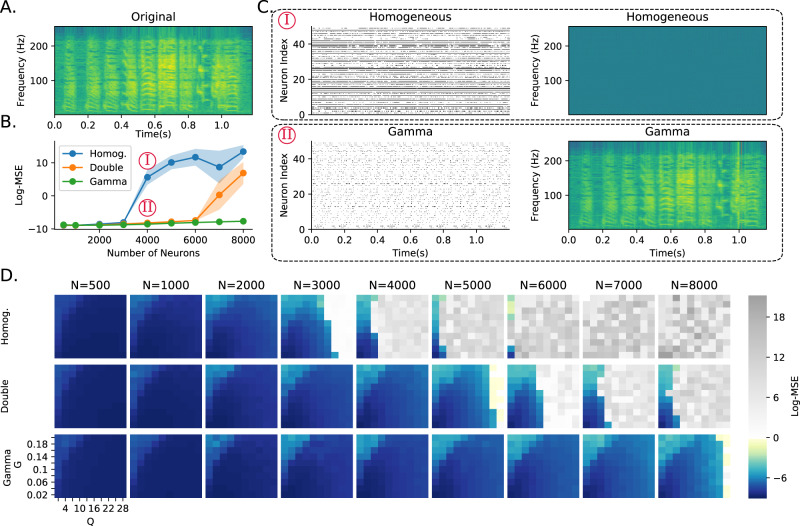
Fig. 3. Robustness to learning hyperparameter mistuning.
A Spectrogram of a zebra finch call. The network has to learn to reproduce this spectrogram, chosen for its spectrotemporal complexity. B Error for three networks at different network sizes (hyperparameters G and Q were chosen to optimise performance at N = 1000 neurons as given in Table 4). Networks are fully homogeneous (Homog); intermediate, where each neuron is randomly assigned slow or fast dynamics (Double); or fully heterogeneous, where each neuron has a random time constant drawn from a gamma distribution (Gamma). C Raster plots of 50 neurons randomly chosen, and reconstructed spectrograms under fully homogeneous and fully heterogeneous (Gamma) conditions for N = 4000 neurons as indicated in B. D Reconstruction error. Each row is one of the three configurations shown as lines in B. Each column is a network size. The axes of each image give the learning hyperparameters (G and Q). Grey pixels correspond to log mean square error above 0, corresponding to a complete failure to reconstruct the spectrogram. The larger the coloured region, the more robust the network is, and less tuning is required.

