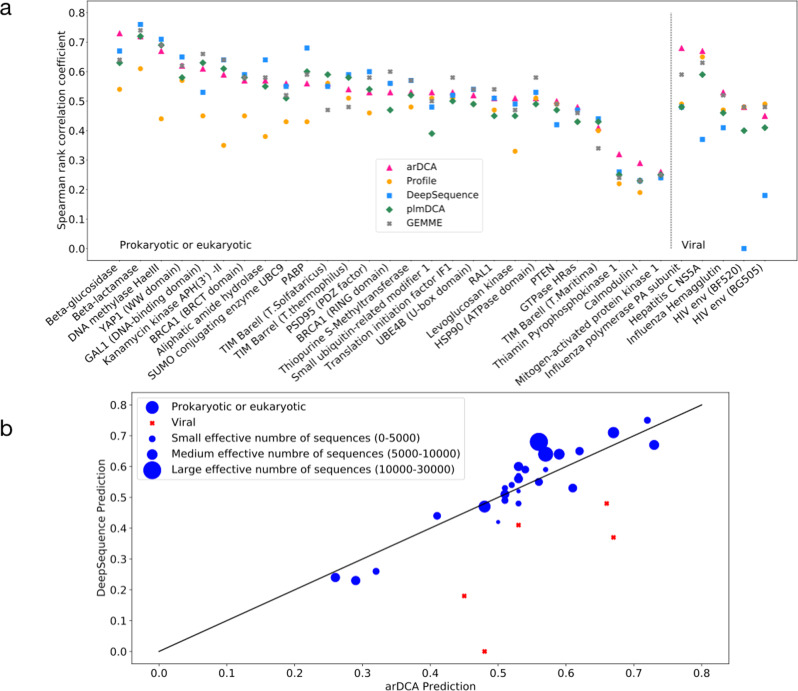
Fig. 3. Prediction of mutational effects by arDCA.
Panel a shows the Spearman rank correlation between results of 32 deep-mutational scanning experiments and various computational predictions. We compare arDCA with profile models, plmDCA (aka evMutation10), DeepSequence33, and GEMME59, which currently are considered the state of the art. Detailed information about the datasets and the generative properties of arDCA on these datasets are provided in Supplementary Note 4. Panel b shows a more detailed comparison between arDCA and DeepSequence, the symbol size is proportional to the sequence number in the training MSA for prokaryotic and eukaryotic datasets (blue dots). Viral datasets are indicated by red squares.

