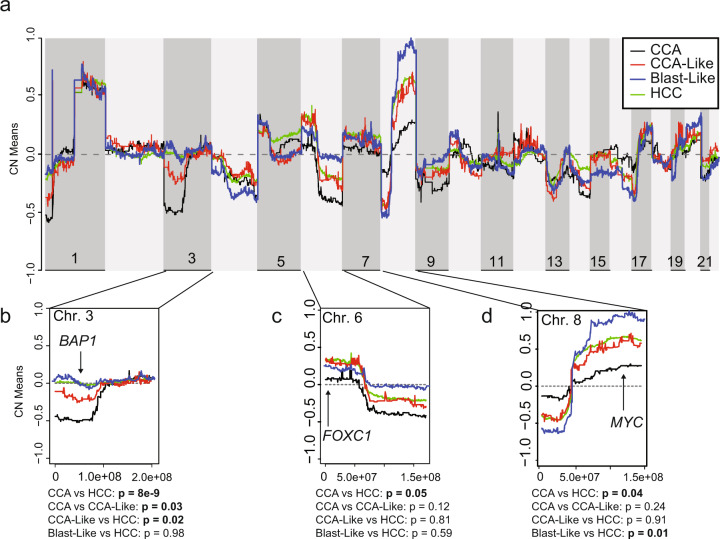
Fig. 5. Copy number landscapes show tissue-specific specificity.
a Genome-wide copy number values are plotted for CCA (black), CCA-Like (red), Blast-Like (blue), and HCC (green) using the mean quantitative gene-level copy measurements from GISTIC. b−d Expanded view of three chromosomes containing regions significantly differed by pairwise two-sample t-tests (p-value <0.05) between CCA and HCC. Potential target genes in significant segments are noted.

