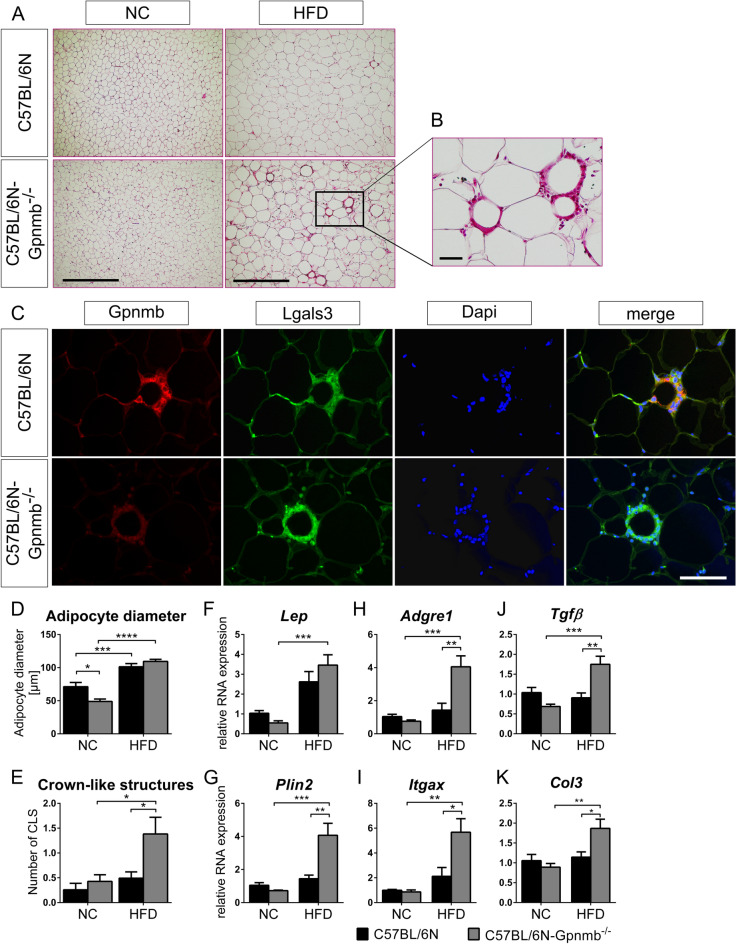
Figure 1.
Analysis of epididymal adipose tissue of lean or HFD-fed, male Gpnmb-/- and wildtype mice. (A) Representative pictures of hematoxylin and eosin staining of 10 µm sections of epididymal adipose tissue. Scale bar: 500 µm (B) Crown-like structure (CLS). Scale bar: 50 µm. (C) Gpnmb and macrophage localization in immunohistological stainings of 7 µm adipose tissue sections. Scale bar: 100 µm. (D,E) Analysis of histological adipose tissue sections. On average 11 microscopic views (1.56 mm2) were analyzed per animal. (D) The size of on average 37 cells was measured per microscopic view. (F–K) Transcript levels of inflammatory genes measured by qRT-PCR. Relative RNA expression was calculated using the 2-∆∆Ct method, normalized to the housekeeping genes and to NC-fed, wildtype animals. NC: normal chow, HFD: high fat diet. (A–E): n = 6–7, (F–K) n = 5–7, mean ± SEM. Statistical differences were determined by a Two-way ANOVA with Bonferroni post-hoc tests; * p < 0.05; **p < 0.01; *** p < 0.001; **** p < 0.0001.

