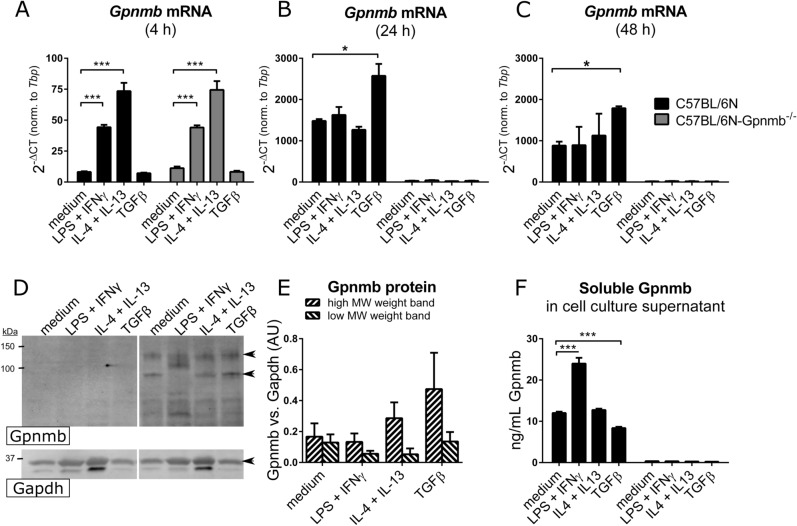
Figure 3.
Gpnmb mRNA and protein levels of differently polarized Gpnmb-/- and wildtype macrophages. Cells were treated with IL-4 and 20 ng/mL IL-13, or TGFβ, or LPS and IFNγ. (A–C) Transcript levels were measured by qRT-PCR after 4 h (A), 24 h (B) or 48 h (C). (D–F) Gpnmb protein expression and release of differently polarized macrophages after 48 h. (D) Exemplary Western blot of stimulated cell extracts. Undiluted lysates were loaded onto a SDS gel. Cropped image, the respective full-length blots are presented in Fig. S9. (E) Quantification of the two characteristic Gpnmb bands (indicated by arrows in D) of wildtype macrophage extracts, normalized to Gapdh signal as loading control. (F) Quantification of released soluble Gpnmb in cell culture supernatant by ELISA. n = 3, meaning BMDMs from three individual mice per group, mean ± SEM. Statistical differences were determined by a Two-way ANOVA with Bonferroni post-hoc tests; * p < 0.05; *** p < 0.001.

