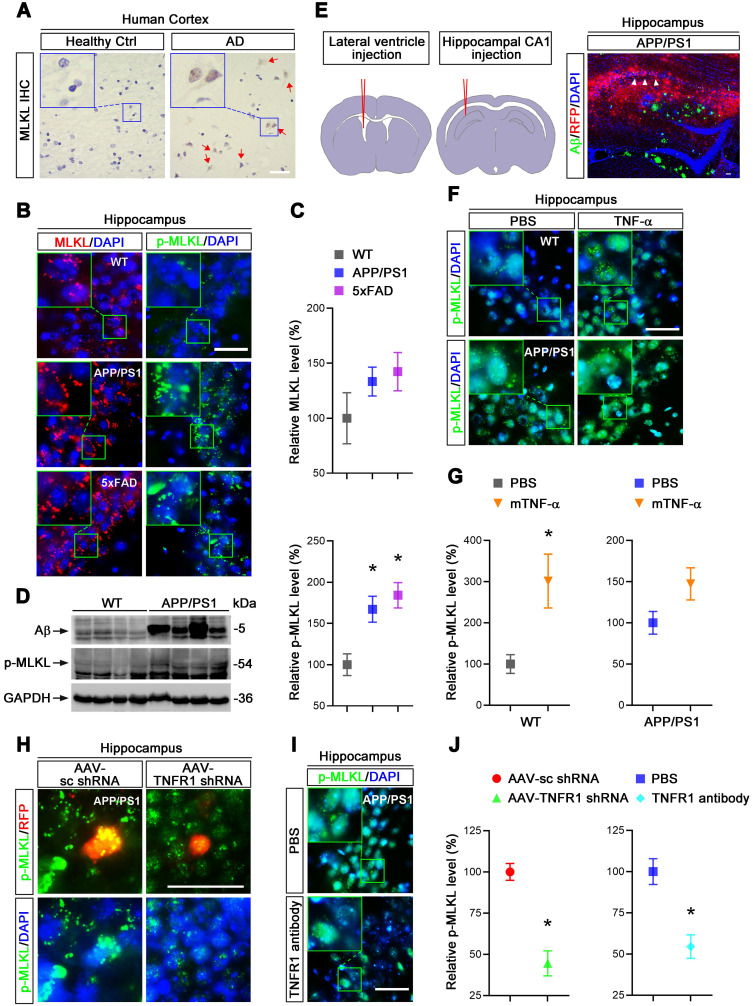
Figure 1.
TNF-α/TNFR1-dependent neuronal necroptosis is activated in AD models. (A) DAB staining immunohistochemistry (IHC) shows the MLKL levels in the cortexes from AD patients and healthy controls. Nuclei were counterstained with hematoxylin. Arrows indicate positive IHC staining. (B) Immunofluorescence (IF) images show the levels of MLKL (red) or p-MLKL (green) in the hippocampal CA1 regions from WT, APP/PS1 and 5×FAD mice respectively. Nuclei were counterstained with DAPI. (C) Quantitation of MLKL and p-MLKL levels in (B). The protein levels in WT were normalized as 100%. (D) Immunoblotting shows the protein levels of Aβ and p-MLKL in hippocampus from WT and APP/PS1 mice. (E) Schematic overview shows lateral ventricle injection of murine TNF-α (left) and intrahippocampal CA1 injection of anti-TNFR1 neutralizing antibody or AAV particles (middle). Image shows Aβ IF staining and RFP in AAV-transduced cells in APP/PS1 mice (right). Arrowheads, CA1 region. (F) IF images show p-MLKL (green) levels in WT or APP/PS1 with mTNF-α or PBS injection. (G) Quantitation of p-MLKL levels in (F). (H) IF images show the levels of p-MLKL (green) in APP/PS1 mice injected with AAV-scramble control (sc) shRNA-RFP or AAV-TNFR1 shRNA-RFP. (I) IF images show the p-MLKL (green) levels in WT or APP/PS1 with or without anti-TNFR1 neutralizing antibody injection. (J) Quantitation of p-MLKL levels in (H) and (I). Scale bar, 25 μm. Error bars indicate mean ± SEM from at least 20 RFP-labeled cells, n=3~5 mice per group; *p < 0.05, one-way ANOVA test.

