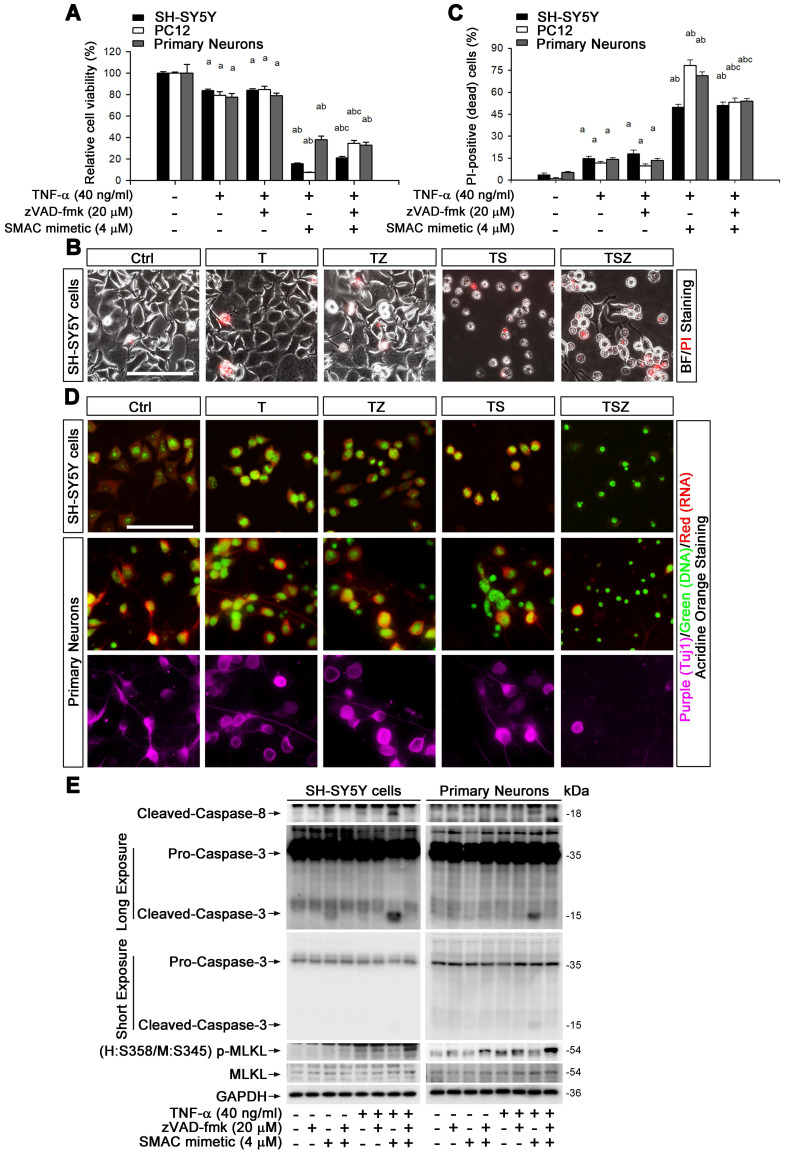
Figure 2.
TNF-α induces neuronal necroptosis in cell cultures. (A) Quantitation of cell viability from neuronal cell cultures with or without indicated TNF-α (T), zVAD (Z), and SMAC mimetic (S) treatment. (B) Images of propidium iodide (PI) staining (red) in SH-SY5Y cells after TSZ treatment. BF, bright field. (C) Quantitation of PI-positive cells from SH-SY5Y, PC12 and primary neurons after indicated treatments. (D) Images of acridine orange (AO) staining of nuclei (green) and cytoplasm (red) in TSZ treated SH-SY5Y cells (upper panels) and in primary neurons (lower panels). Tuj1 (purple) as a neuronal marker. (E) Immunoblotting shows levels of Caspase 3, Caspase 8, p-MLKL, and MLKL in SH-SY5Y cells (left panels) and in primary neurons (right panels) with TSZ treatments. GADPH as a loading control. Scale bar, 25 μm. ap < 0.05, difference with control group; bp < 0.05, difference with TNF-α treated group; cp < 0.05, difference with TS treated group. Data represent mean ± SEM, n=3~5 independent experiments; analysis was performed by one-way ANOVA test.

