Figure 4.
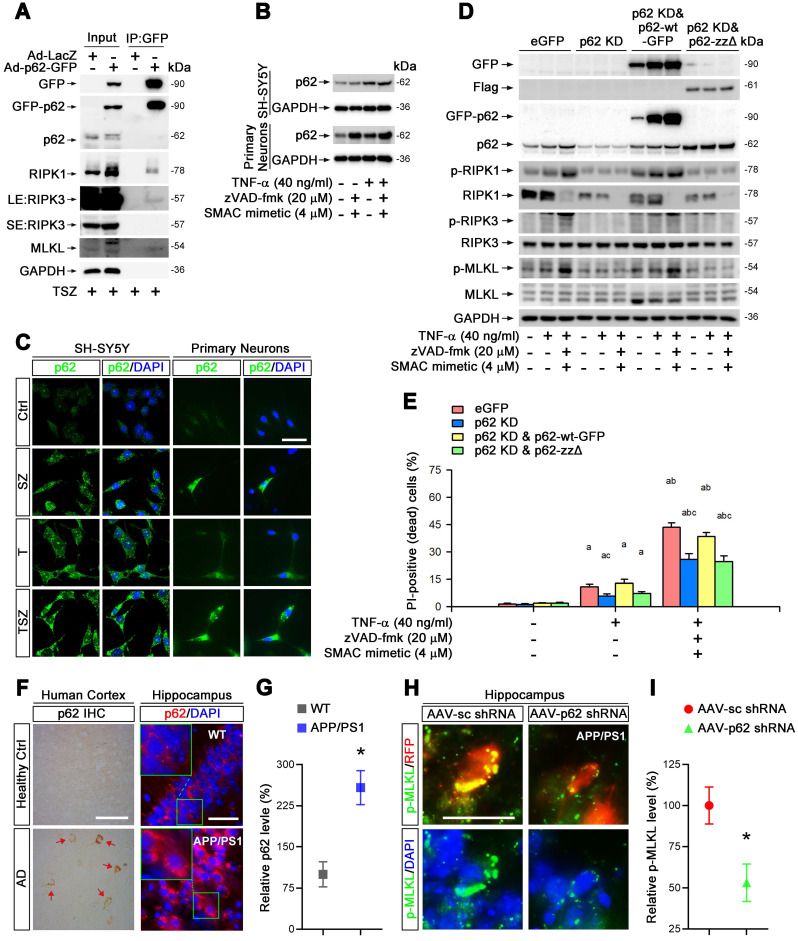
p62 mediates TNF-α-induced necroptosis via interaction with RIPK1. (A) GFP immunoprecipitation (IP) with total lysates of SH-SY5Y cells was followed by immunoblotting with the indicated antibodies. (B) Immunoblotting shows levels of p62 with indicated TSZ treatments in SH-SY5Y cells (upper panels) or primary neurons (lower panels). GADPH as a loading control. (C) IF images show the levels of p62 (green) in SH-SY5Y cells (left panels) or primary neurons (right panels) with indicated treatments. (D) Immunoblotting of cell lysates from the SH-SY5Y cells transduced with lentiviral particles expressing eGFP (Ctrl), p62 shRNA (p62 KD), p62 shRNA combined with RNAi-resistant wild type p62 (p62 KD & p62-wt) or p62 shRNA combined with RNAi-resistant zz domain-deleted p62 (p62 KD & p62-zzΔ) using the indicated antibodies. (E) Quantitation of PI-positive cells from the SH-SY5Y cells with indicated vector expression and TSZ treatments in (D). (F) DAB staining IHC (left) show the p62 levels in the cortical tissues from AD patients and healthy controls. Arrows indicate positive DAB staining. IF (right) show the levels of p62 (red) in the hippocampal CA1 from WT and APP/PS1 mice. Nuclei were counterstained with DAPI. (G) Quantitation of p62 levels in (F, right panels). The protein levels in WT were normalized as 100%. (H) IF images show the levels of p-MLKL (green) in APP/PS1 injected with AAV particles expressing sc shRNA-RFP (left panels) or p62 shRNA-RFP (right panels). (I) Quantitation of p-MLKL levels from RFP-labeled cells in (H). Scale bar, 25 μm. Error bars indicate mean ± SEM from at least 20 RFP-labeled cells, n=3~5 mice per group, or 3~5 independent cell culture experiments. *p < 0.05, difference with WT mice group or sc shRNA injection group; ap < 0.05, difference with control group; bp < 0.05, difference with TNF-α treated group; cp < 0.05, difference with eGFP group; analysis was performed by one-way ANOVA test.

