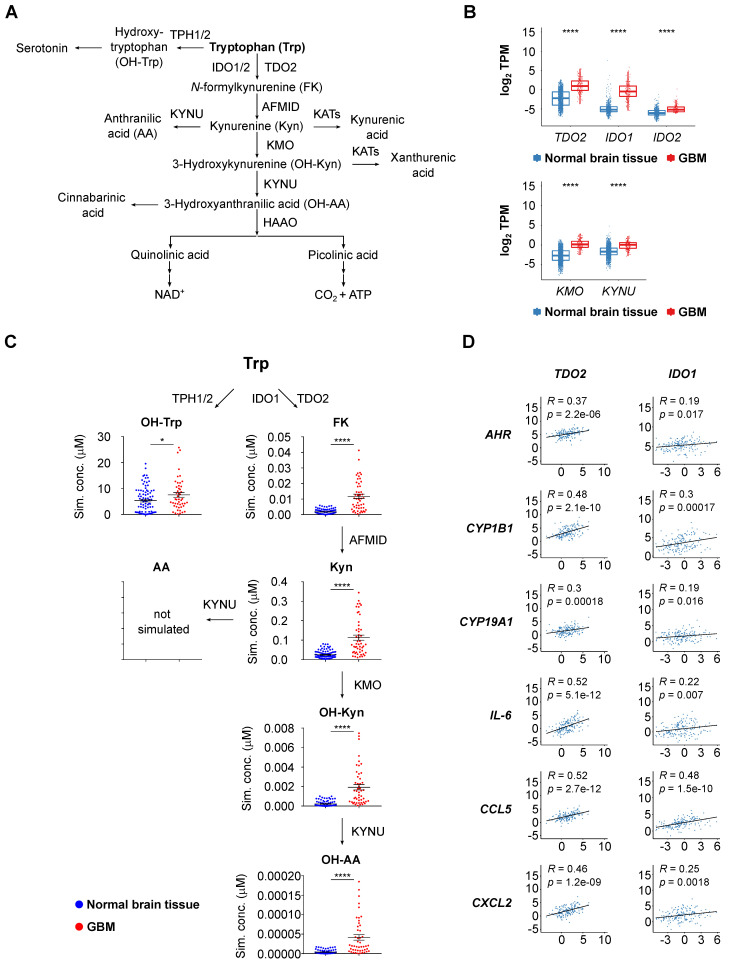
Figure 1.
Upregulated Trp metabolism correlates with AHR activity in glioblastoma. (A) Schematic representation of Trp metabolism. (B) Boxplot representation of the expression of select Trp metabolism-associated enzymes in normal brain tissue (blue) (GTEx data) and in glioblastoma (GBM) tissue (red) (TCGA data) represented as log2 transcripts per million (log2 TPM) (Wilcoxon rank-sum test, **** P < 0.0001). (C) RNA-seq data from the GTEx and TCGA databases were integrated into a mathematical model of Trp metabolism to predict the metabolite concentrations in healthy brain or GBM tissue for: OH-Trp, FK, Kyn, OH-Kyn, OH-AA. Data are mean +/- SEM, outliers were excluded with ROUT. Data were analyzed with two-tailed unpaired Student's t test. *P < 0.05, ****P < 0.0001. (D) Pearson's correlation coefficient (R) estimated for the expression of the Trp-degrading enzymes TDO2 or IDO1, and the expression of select AHR target genes in GBM tissue (TCGA data). P values are given as numbers. See also Figure S1. Abbreviations: AA: anthranilic acid; AFMID: arylformamidase; AHR: aryl hydrocarbon receptor; FK: N-formylkynurenine; GBM: glioblastoma; GTEx: Genotype-Tissue Expression; HAAO: 3-hydroxy-anthranilic acid-3,4-dioxygenase; IDO1: indoleamine-2,3-dioxygenase 1; KATs: kynurenine aminotransferases; KMO: kynurenine 3-monooxygenase; Kyn: kynurenine; KYNU: kynureninase; NAD+: nicotinamide adenine dinucleotide; OH-AA: hydroxy-anthranilic acid; OH-Kyn: hydroxy-kynurenine; OH-Trp: hydroxy-tryptophan; R: Pearson's correlation coefficient; RNA-seq: RNA-sequencing; ROUT: robust regression and outlier removal; SEM: Standard error of mean; Sim. conc.: simulated concentrations; TCA: trichloroacetic acid; TCGA: The Cancer Genome Atlas; TDO2: tryptophan-2,3-dioxygenase; TPH1/2: tryptophan hydroxylase 1/2; TPM: transcripts per million; Trp: tryptophan.

