Figure 1.
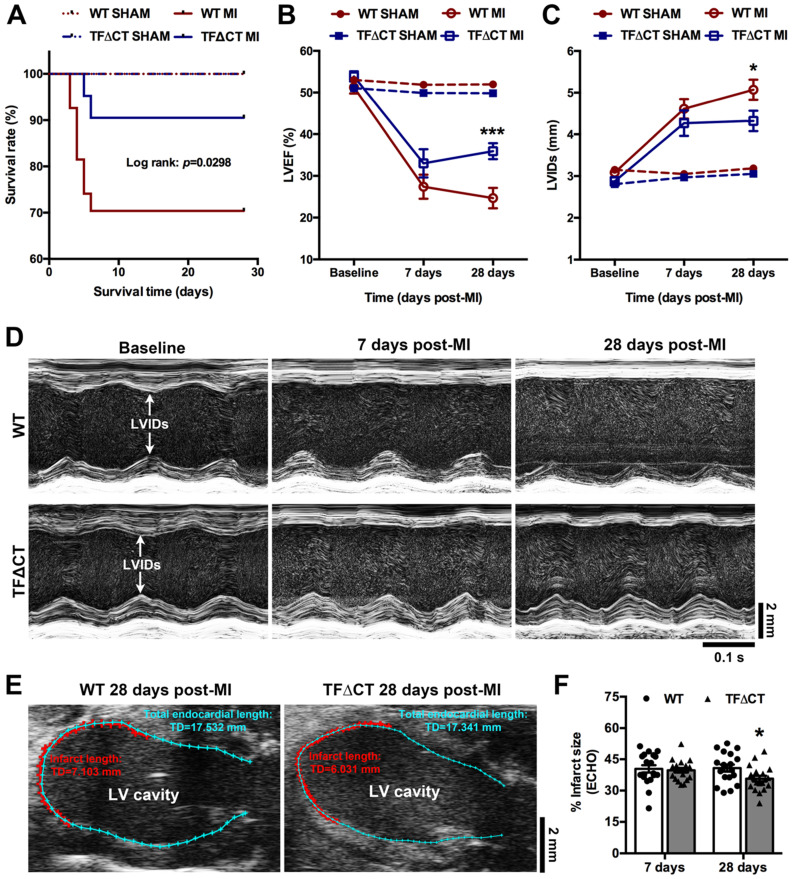
Lack of the TF cytoplasmic domain promotes survival and protects cardiac function after MI. (A) The Kaplan-Meier survival curves. Log-rank test; n = 27 for WT mice and n = 21 for TF∆CT mice subjected to MI, n = 10 for WT and n = 9 for TF∆CT sham groups. (B and C) LVEF and LVIDs determined by echocardiography. *P < 0.05, ***p < 0.001 compared with WT mice by two-way ANOVA with Bonferroni post hoc test; n = 19 for WT mice and n = 19 for TF∆CT mice surviving MI, n = 10 for WT and n = 9 for TF∆CT sham groups. (D) Representative echocardiograms (M-mode tracing) illustrating cardiac changes after MI in WT versus TF∆CT mice. (E and F) Post-MI infarct size was estimated by measuring the length of myocardial infarct (in RED) and total length of LV endocardium (in CYAN) at the middle plane of the long-axis LV echocardiogram as indicated. Infarct size (%) = (length of infarct / length of LV endocardium) x 100. *P < 0.05, compared with WT, two-way ANOVA with Bonferroni post hoc test for multiple comparison. LVEF, left ventricular ejection fraction; LVIDs, internal diameter at end of systole.

