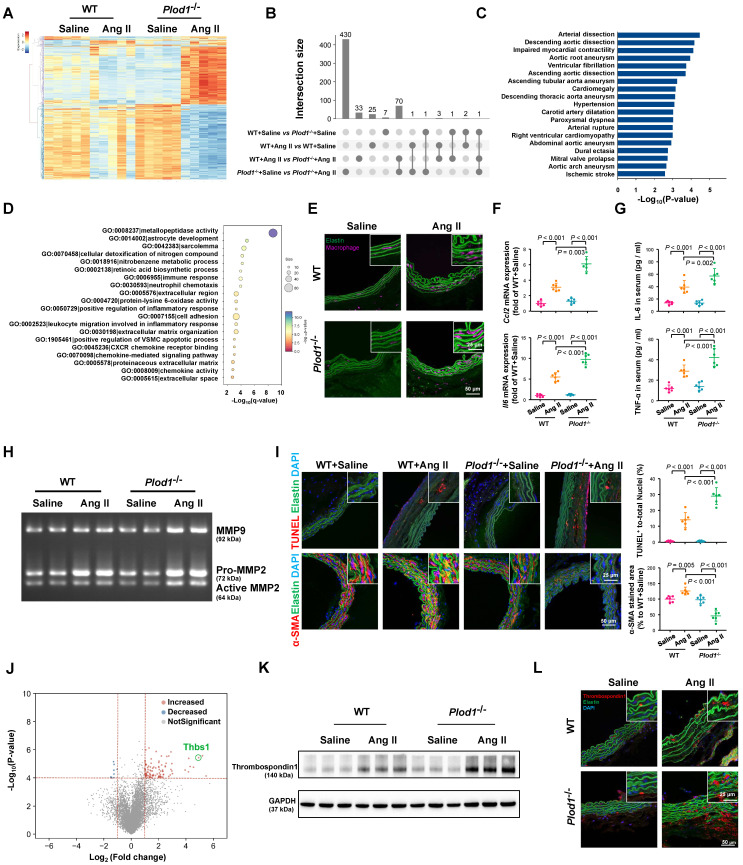
Figure 3.
Lysyl hydroxylase 1 (LH1) deficiency aggravates inflammation, matrix metalloproteinase (MMP) activity and apoptosis of vascular smooth muscle cells (VSMCs) in the abdominal aorta. A, Cluster analysis heat map showing the transcript levels of differentially expressed genes (DEGs) in the abdominal aortas of wild-type (WT) and procollagen-lysine, 2-oxoglutarate 5-dioxygenase 1 (Plod1)-/- mice following 2 weeks of saline or angiotensin II (Ang II) infusion. The color scale illustrates the relative expression levels across all samples: red represents an expression level above the mean, and blue represents an expression level lower than the mean. The dendrogram on the left of the heat map shows the clustering of the transcripts (n = 5). B, UpSet plot of the intersection of four groups. The histogram shows the number of DEGs in each subset. C, Human Phenotype Ontology analysis of DEGs between Plod1-/- and WT mice after Ang II infusion. D, Top enriched terms, as identified by from Gene Ontology (GO) enrichment analysis of the DEGs between Plod1-/- and WT mice after Ang II infusion. E, Representative immunofluorescence staining of macrophages in the abdominal aorta after 4 weeks of saline or Ang II infusion. The insets are higher magnification images. F, mRNA expression of the inflammatory cytokines Ccl2 and Il6 in the abdominal aorta (n = 6). G, Serum levels of the proinflammatory cytokines interleukin (IL)-6 and tumor necrosis factor alpha (TNF-α) were measured by ELISA (n = 6). H, Representative gelatin zymography of abdominal aortas from the indicated groups. I, Representative images and quantification of apoptotic cells (upper) and α-SMA expression (lower) in the abdominal aorta (n = 6). J, Volcano plot displaying DEGs between Plod1-/- and WT mice after Ang II infusion. K, Representative immunoblotting images for thrombospondin-1 in the abdominal aortas of WT and Plod1-/- mice. L, Representative immunostaining images of thrombospondin-1 (red), elastin (green) and DAPI (blue) in the abdominal aorta. Two-way ANOVA followed by Bonferroni post hoc test.

