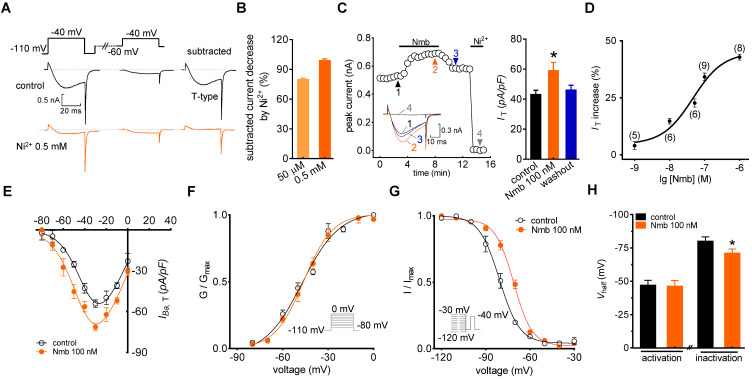
Figure 1.
Nmb enhances IT in TG neurons. A, left panel, representative recording from small TG neurons before and after 0.5 mM NiCl2 (Ni2+) application. Currents were recorded by a 40 ms depolarizing step pulse from the holding potential of -110 mV or -60 mV to -40 mV. Inset: remaining current (IT) after off-line subtraction. B, summary data indicate the inhibition of Ni2+ at 50 µM (n = 5) or 0.5 mM on IT (n = 5). Ni2+ at 0.5 mM completely blocked IT in TG neurons. C, time course (left panel) and summary data (right panel) show the effect of 100 nM Nmb on IT (n = 9). Insets indicate the exemplary current traces. The Arabic numbers represent points used for representative traces. Ni2+ (0.5 mM) was applied at the end of each voltage-clamp recording to determine the current baseline. IT were then calculated by digitally subtracting currents after Ni2+-treatment from those before application of NiCl2. This protocol is used for calculation of pure IT amplitude in all recordings. *p < 0.05 versus control, two-tailed t test. D, dose-dependent effects of Nmb on IT. Solid line represents the sigmoidal dose-response fits. Numbers in parentheses denote n cells tested at each concentration. E, current-voltage (I-V) plots show the effect of 100 nM Nmb on the current density of T-type channels at each voltage (n = 8). Currents were elicited by test pulses that range from -80 mV to 0 mV in increments of +10 mV. F-G, application of 100 nM Nmb had no significant effect on the voltage-dependent activation curve (F), but shifted the steady-state inactivation curve towards a depolarizing direction (G). Insets, stimulation protocols. H, summary data show respective effects of Nmb (100 nM) on Vhalf of the activation (n = 9) and inactivation (n = 9) curves indicated in panels F and G, respectively. *p < 0.05 versus control, two-tailed t test.

