Figure 3.
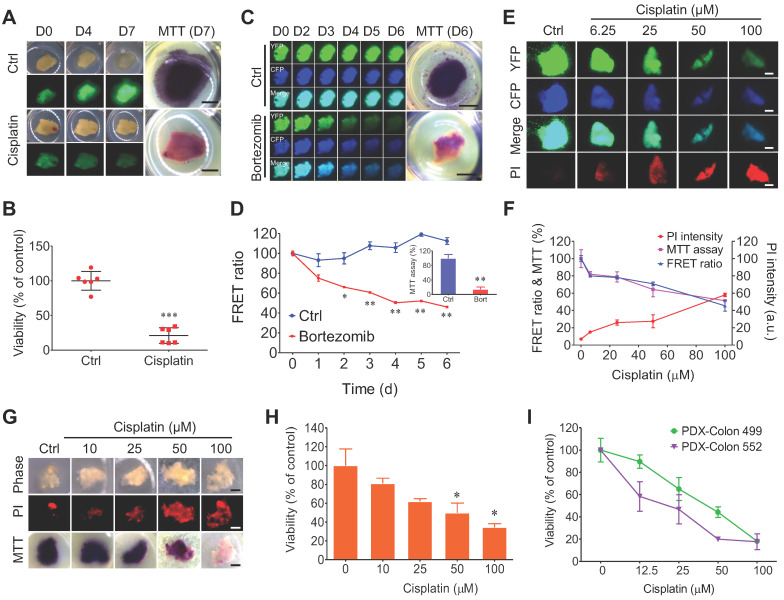
Quantitative evaluating response of 3D-TSCs to anti-cancer drugs by MTT assay. A Imaging of B477-GFP breast tumor slices treated or not treated with 100 µM cisplatin for 0-7 days by GFP fluorescence and MTT assay. Scale bar: 1mm. B Evaluation of drug efficacy in (A) at day 7 by MTT assay. n = 6. C Imaging of MDA-MB-231-C3 breast tumor slices treated with 1 µM bortezomib for six days by FRET fluorescence (d0-6) and MTT assay (d6). D Evaluation of drug efficacy in (C) by FRET ratio (d0-6) and MTT assay (d6). Scale bar: 2 mm. n = 3. E, F Evaluation of drug efficacy in MDA-MB-231-C3 breast tumor slices treated with various dose of cisplatin for six days by PI, FRET ratio and MTT assay. Scale bar: 1 mm. n = 4. G, Imaging of B477 tumor slices treated with cisplatin for six days by PI and MTT assay. Scale bar: 0.8mm. H Quantification of drug efficacy in (G) by MTT assay. n = 3. I Evaluation of drug efficacy in PDX-Colon tumor slices treated with cisplatin for five days by MTT assay. n = 3, error bars ± SEM, *p < 0.05; **p < 0.01; ***p < 0.001 (control versus CIS/DOX).

